
Dynamic Data Analysis – v5.12.01 - © KAPPA 1988-2017
Chapte
r 2 – T heory- p47/743
2.H.3.f
How about rates?
We are not referring to superposition effects, but to the plain value of the rate, i.e. the effect
of a systematic error on the rate values and/or the formation volume factor B.
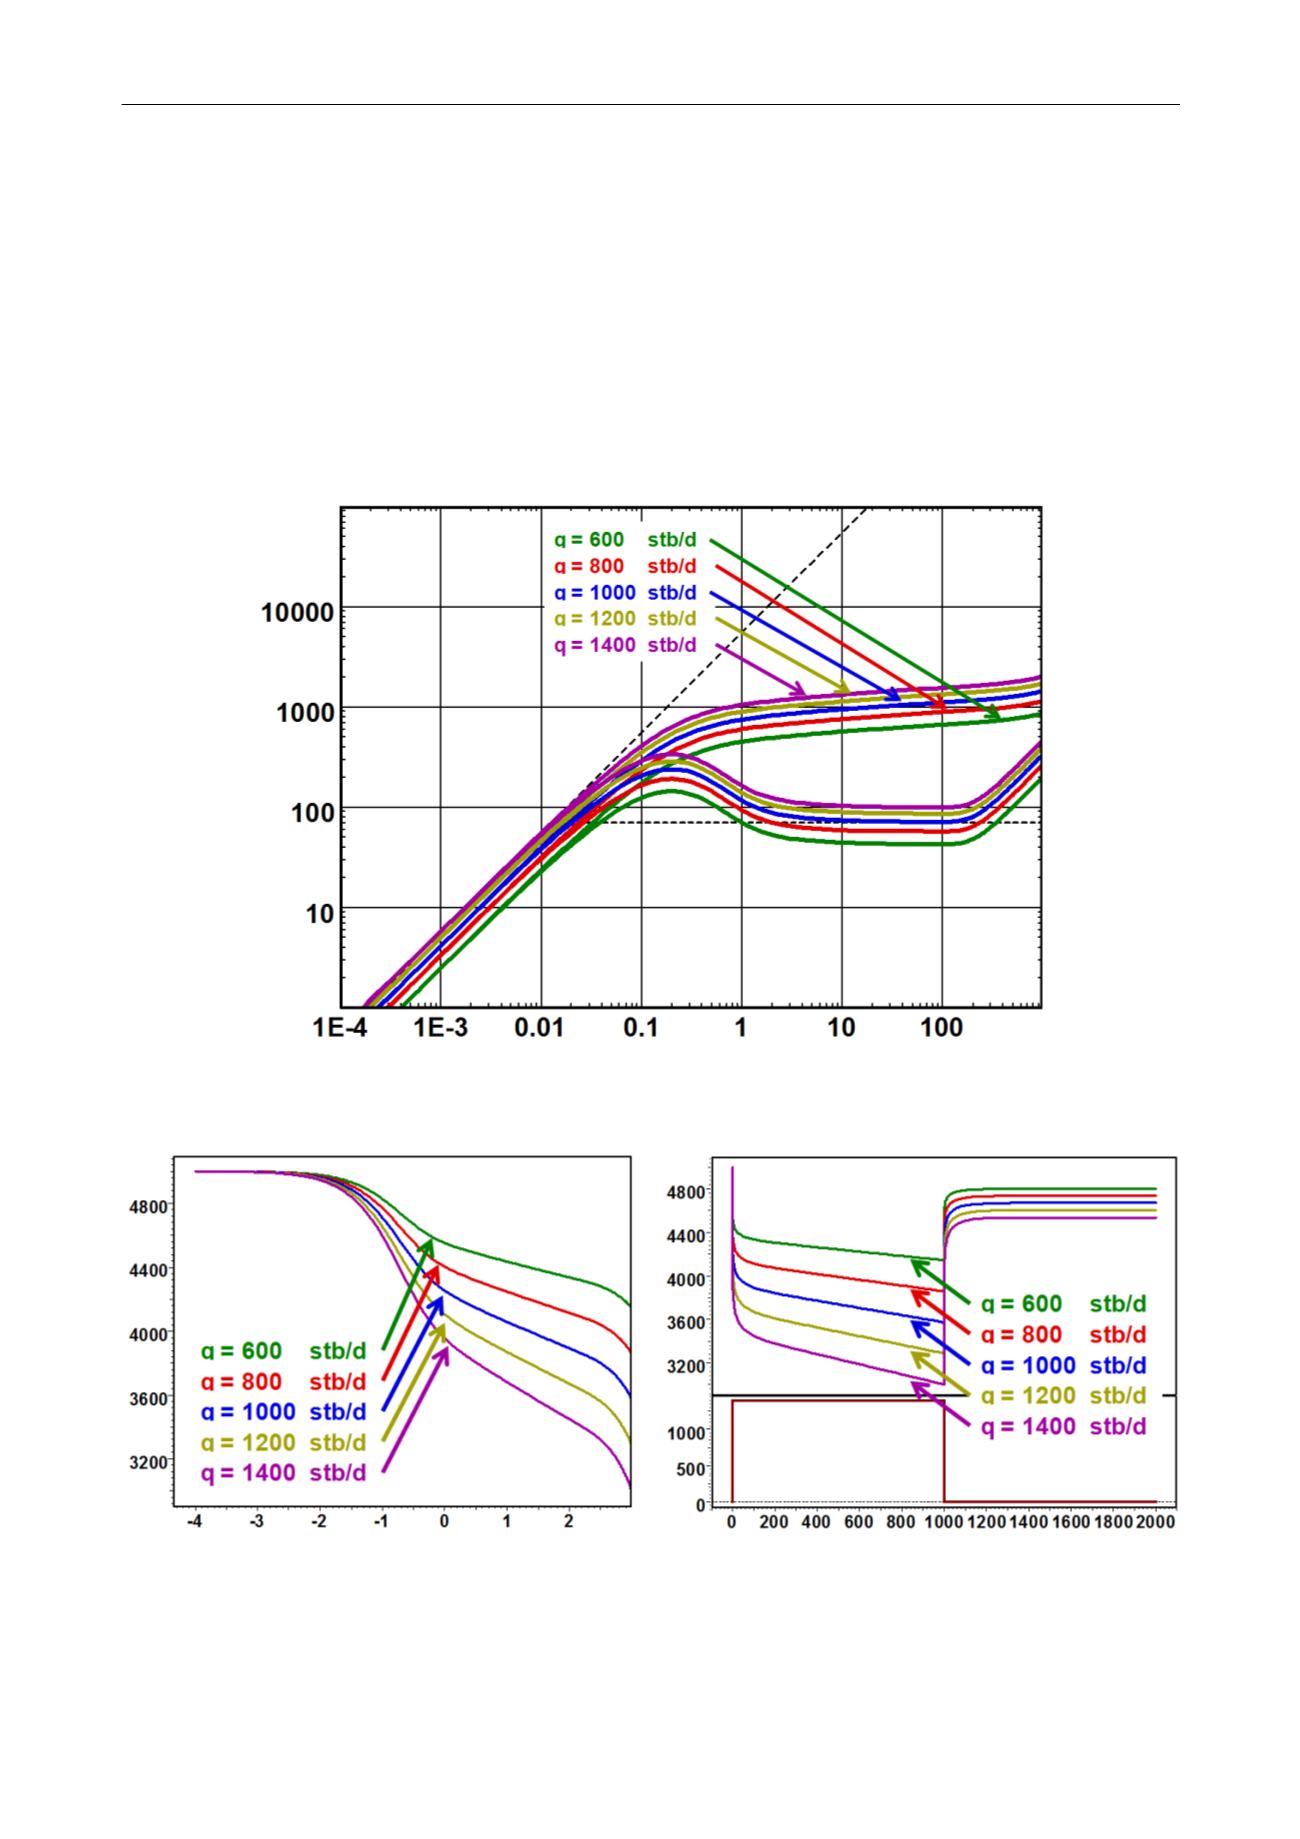
Fig. 2.H.22below illustrates the response with all default parameters constant, but with a
variable rate for each simulation. Values for qB are 600, 800, 1000, 1200 and 1400 rb/d.
The result of varying qB corresponds to a straight multiplication of the pressure change from
pi. The loglog response is shifted vertically, and the semilog and history plots are vertically
compressed or expanded, the fixed point being the initial pressure.
Fig. 2.H.21 – Effect of the rate– qB, loglog plot
Fig. 2.H.22 – Effect of the rate– qB, semilog and history plot


