
Dynamic Data Analysis – v5.12.01 - © KAPPA 1988-2017
Chapte
r 2 – T heory- p27/743
2.D.4
Behavior
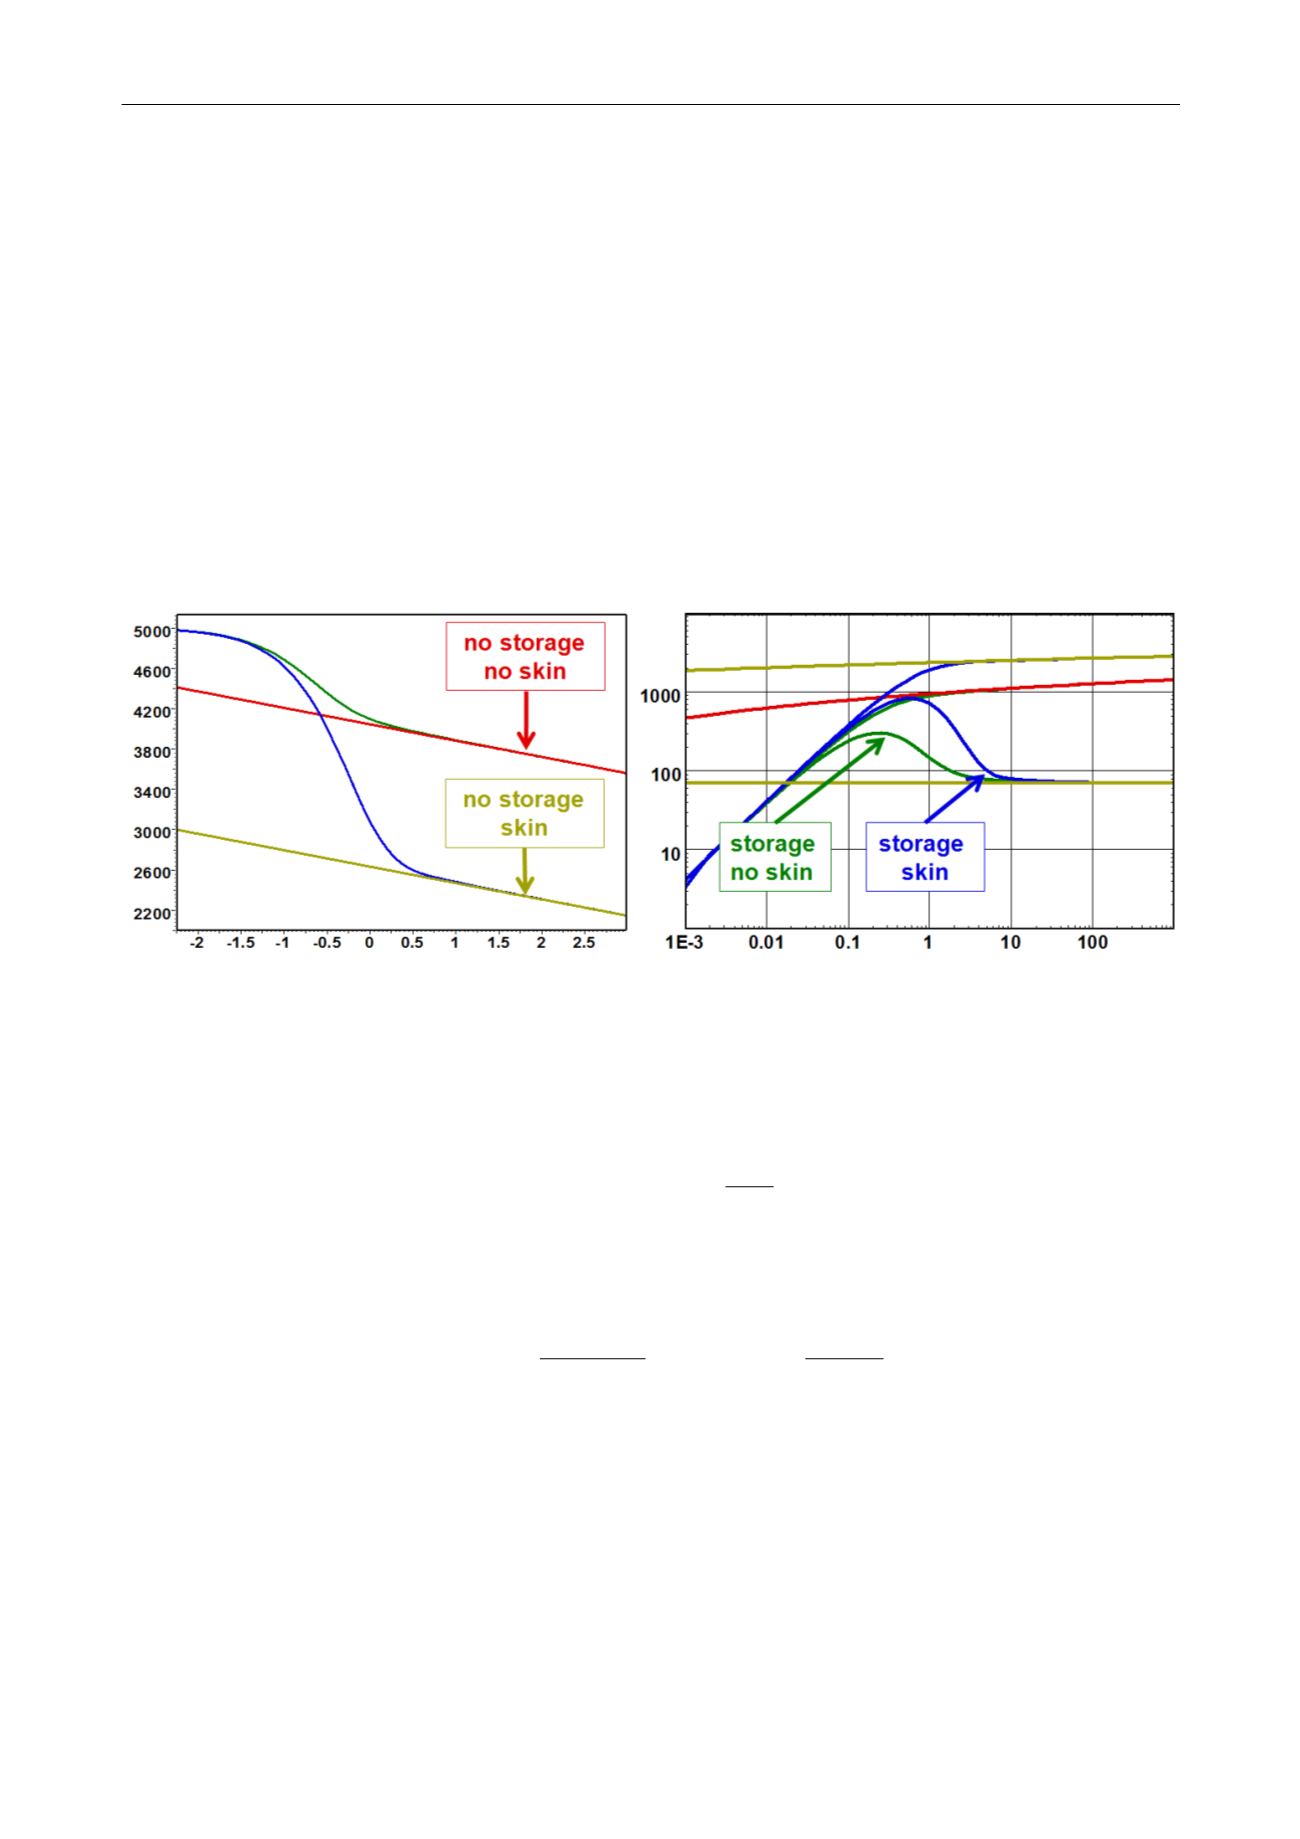
The two figures below show the drawdown response of a vertical well with wellbore storage
and skin in a homogeneous infinite reservoir. The plot on the left shows the response on
semilog scale, with the pressure as a function of log(t). The plot on the right shows the loglog
plot of log(
p) and derivative vs log(
t).
The derivative is developed in the chapter on ‘PTA – General methodology’. The derivative
shown on the right is the absolute value of the slope of the semilog plot on the left. When the
model on the left becomes a straight line, the derivative stabilizes horizontally. The level of
this stabilization is the slope of the model on the left. As all responses end up parallel on the
left plot, then all derivatives merge to the same level on the right plot.
Fig. 2.D.5
–
Finite radius solution,
Fig. 2.D.6 – Finite radius solution,
semilog scale
loglog scale
At early time, the flow is governed by wellbore storage and there is a linear relation between
pressure change and elapsed time:
Early time pure wellbore storage:
t
C
qB
p t p
i
24
At late time, Infinite Acting Radial Flow (IARF) is reached, and there is a linear relation
between the pressure change and the logarithm of the elapsed time:
IARF Equation:
S
rc
k
t
kh
qB
p t p
wt
i
8686 .0 228 .3
log
log
6. 162
2


