
Dynamic Data Analysis – v5.12.01 - © KAPPA 1988-2017
Chapte
r 2 – T heory- p23/743
The relation between the surface and the sandface rate is then given by:
Wellbore storage equation:
t
p
C qB q
sf
24
The simplest wellbore storage model implies that C is constant. However this is not always the
case, and the various models of storage are described in the Wellbore chapter.
2.D.2
Skin
The skin effect quantifies the difference between the productivity of a well in an ideal case and
its effective productivity in reality:
If, after drilling, completion, cementing and perforating, the pressure drop for a given
production into the wellbore is identical to the one you would forecast in the ideal case for
the same geometry, the skin is zero.
Very often, the reservoir near the wellbore had been invaded and the effective permeability
around the well is lowered, thus a higher pressure drop results for a given production. The
skin is then positive.
Conversely, a stimulated well will have better productivity, hence a lower pressure drop for
a given production. The skin is then considered negative.
Skin may not be constant in time. During the initial ‘clean-up’ period in a well test, skin has
a tendency to reduce. Conversely, over long period of times, completed wells may get
damaged reducing productivity, hence an increasing skin.
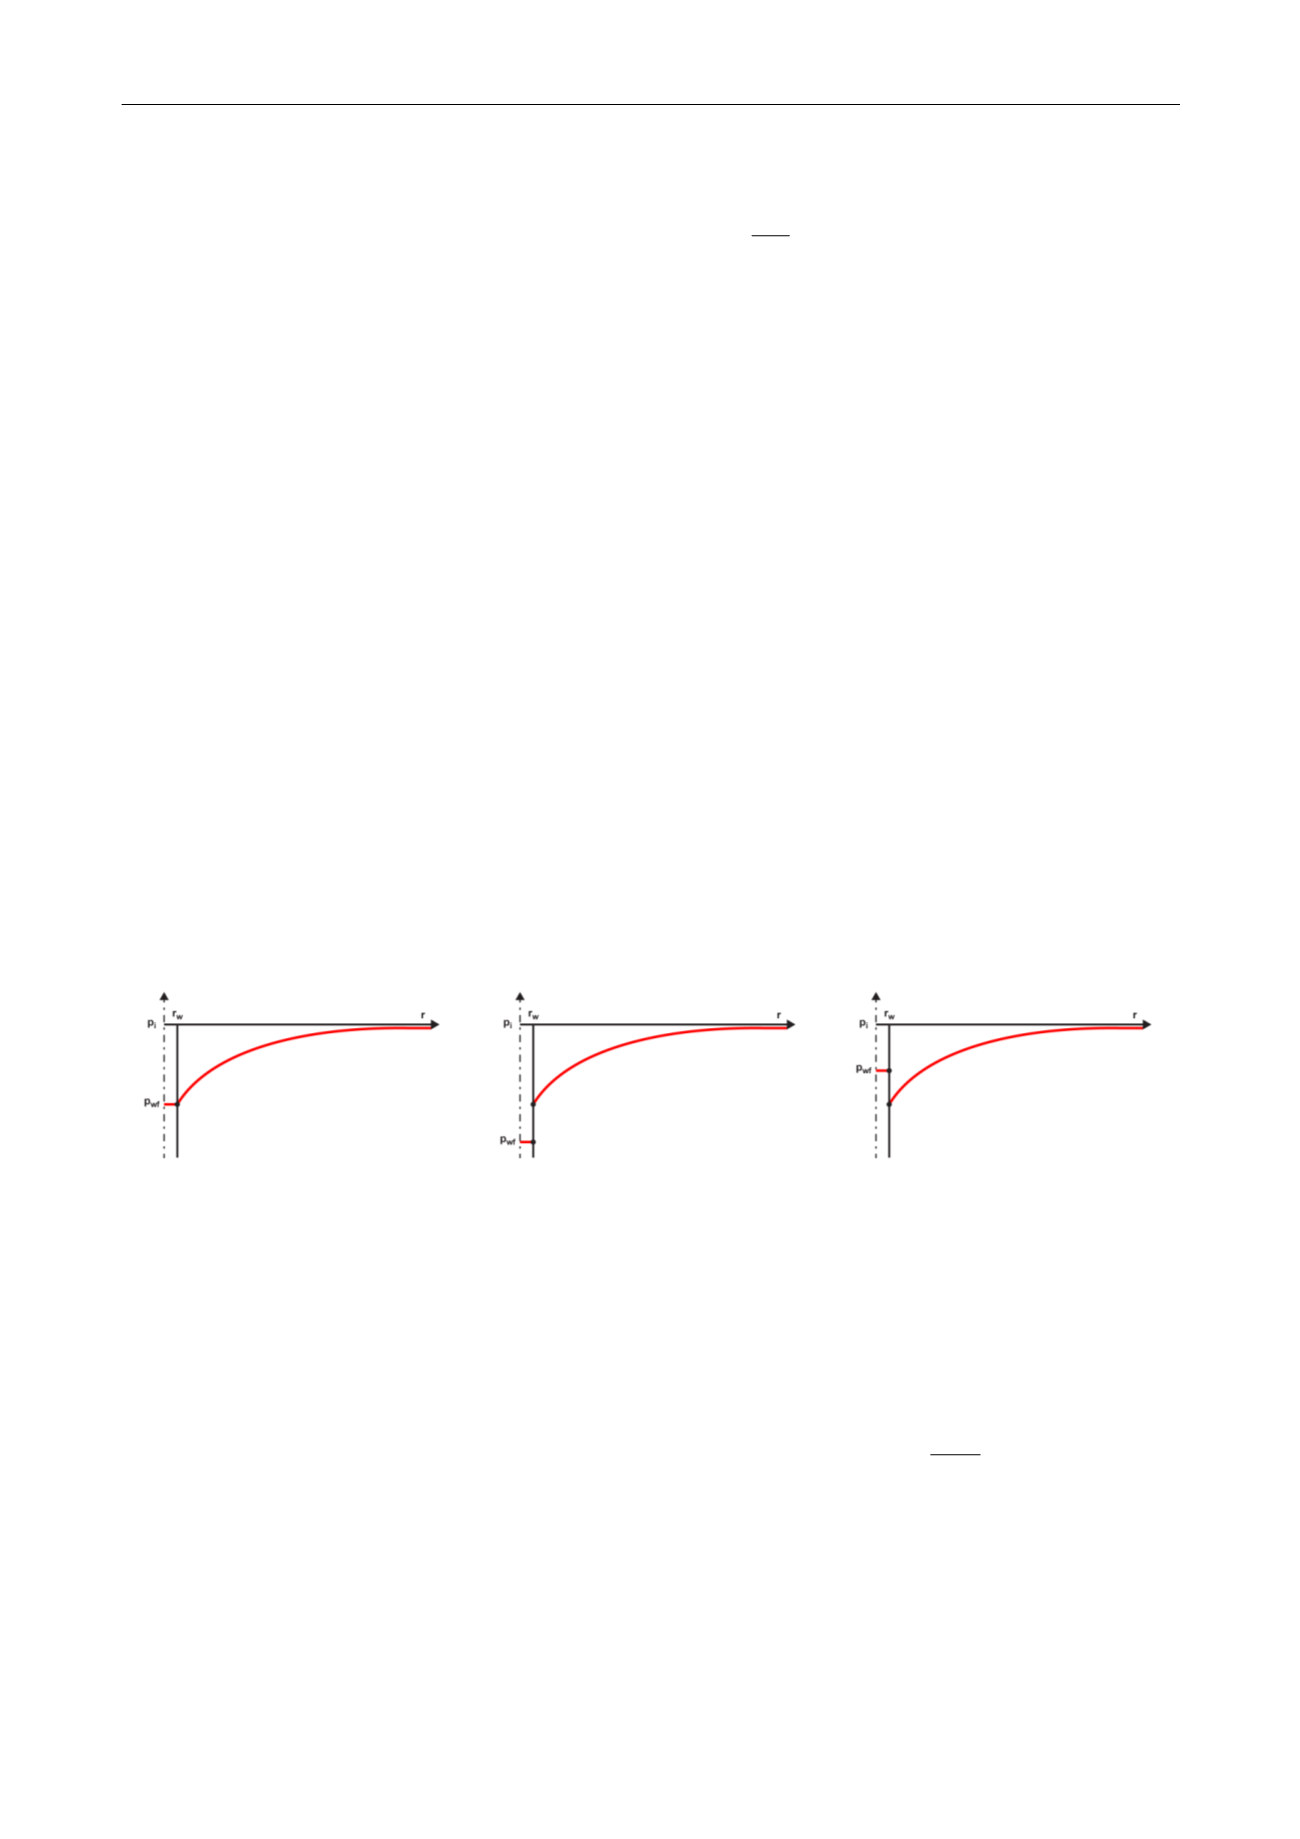
Non damaged skin = 0
Damaged Skin > 0
Stimulated Skin < 0
Fig. 2.D.2 – Skin sign convention
We will consider that a well has a constant skin when the additional pressure drop, or ∆p
skin
, is
proportional to the sandface rate. The skin S is a dimensionless factor representative of a
pressure change, and integrates the same coefficients as the one in Darcy’s law:
Constant skin S:
S
kh
q
t p t rp p
sf
wf
w
Skin
2. 141
,
Where p is the pressure in the formation, at a given time, at distance rw, i.e. just beyond the
sandface, while p
wf
, at a given time, is the well flowing pressure.


