Nodal Analysis is a key technique in the Petroleum Engineer’s toolbox, used to evaluate and optimize the performance of producers and injectors.
The components of the production system are modelled, including wellbore flow, artificial lift and reservoir performance.
Combining the well and reservoir models leads to an estimate of the well’s deliverability, from where is possible to evaluate optimization alternatives, such as modification of tubing size, well head pressure management, addition or changes to the artificial lift system and possible reservoir stimulation.
Grenat is now included in KAPPA Workstation v5.50, complementing the Dynamic Data Analysis workflow.
It is seamlessly connected with all the engineering modules through the K-W browser, allowing it to share well definition, PVT and Vertical Lift Performance (VLP) curves.
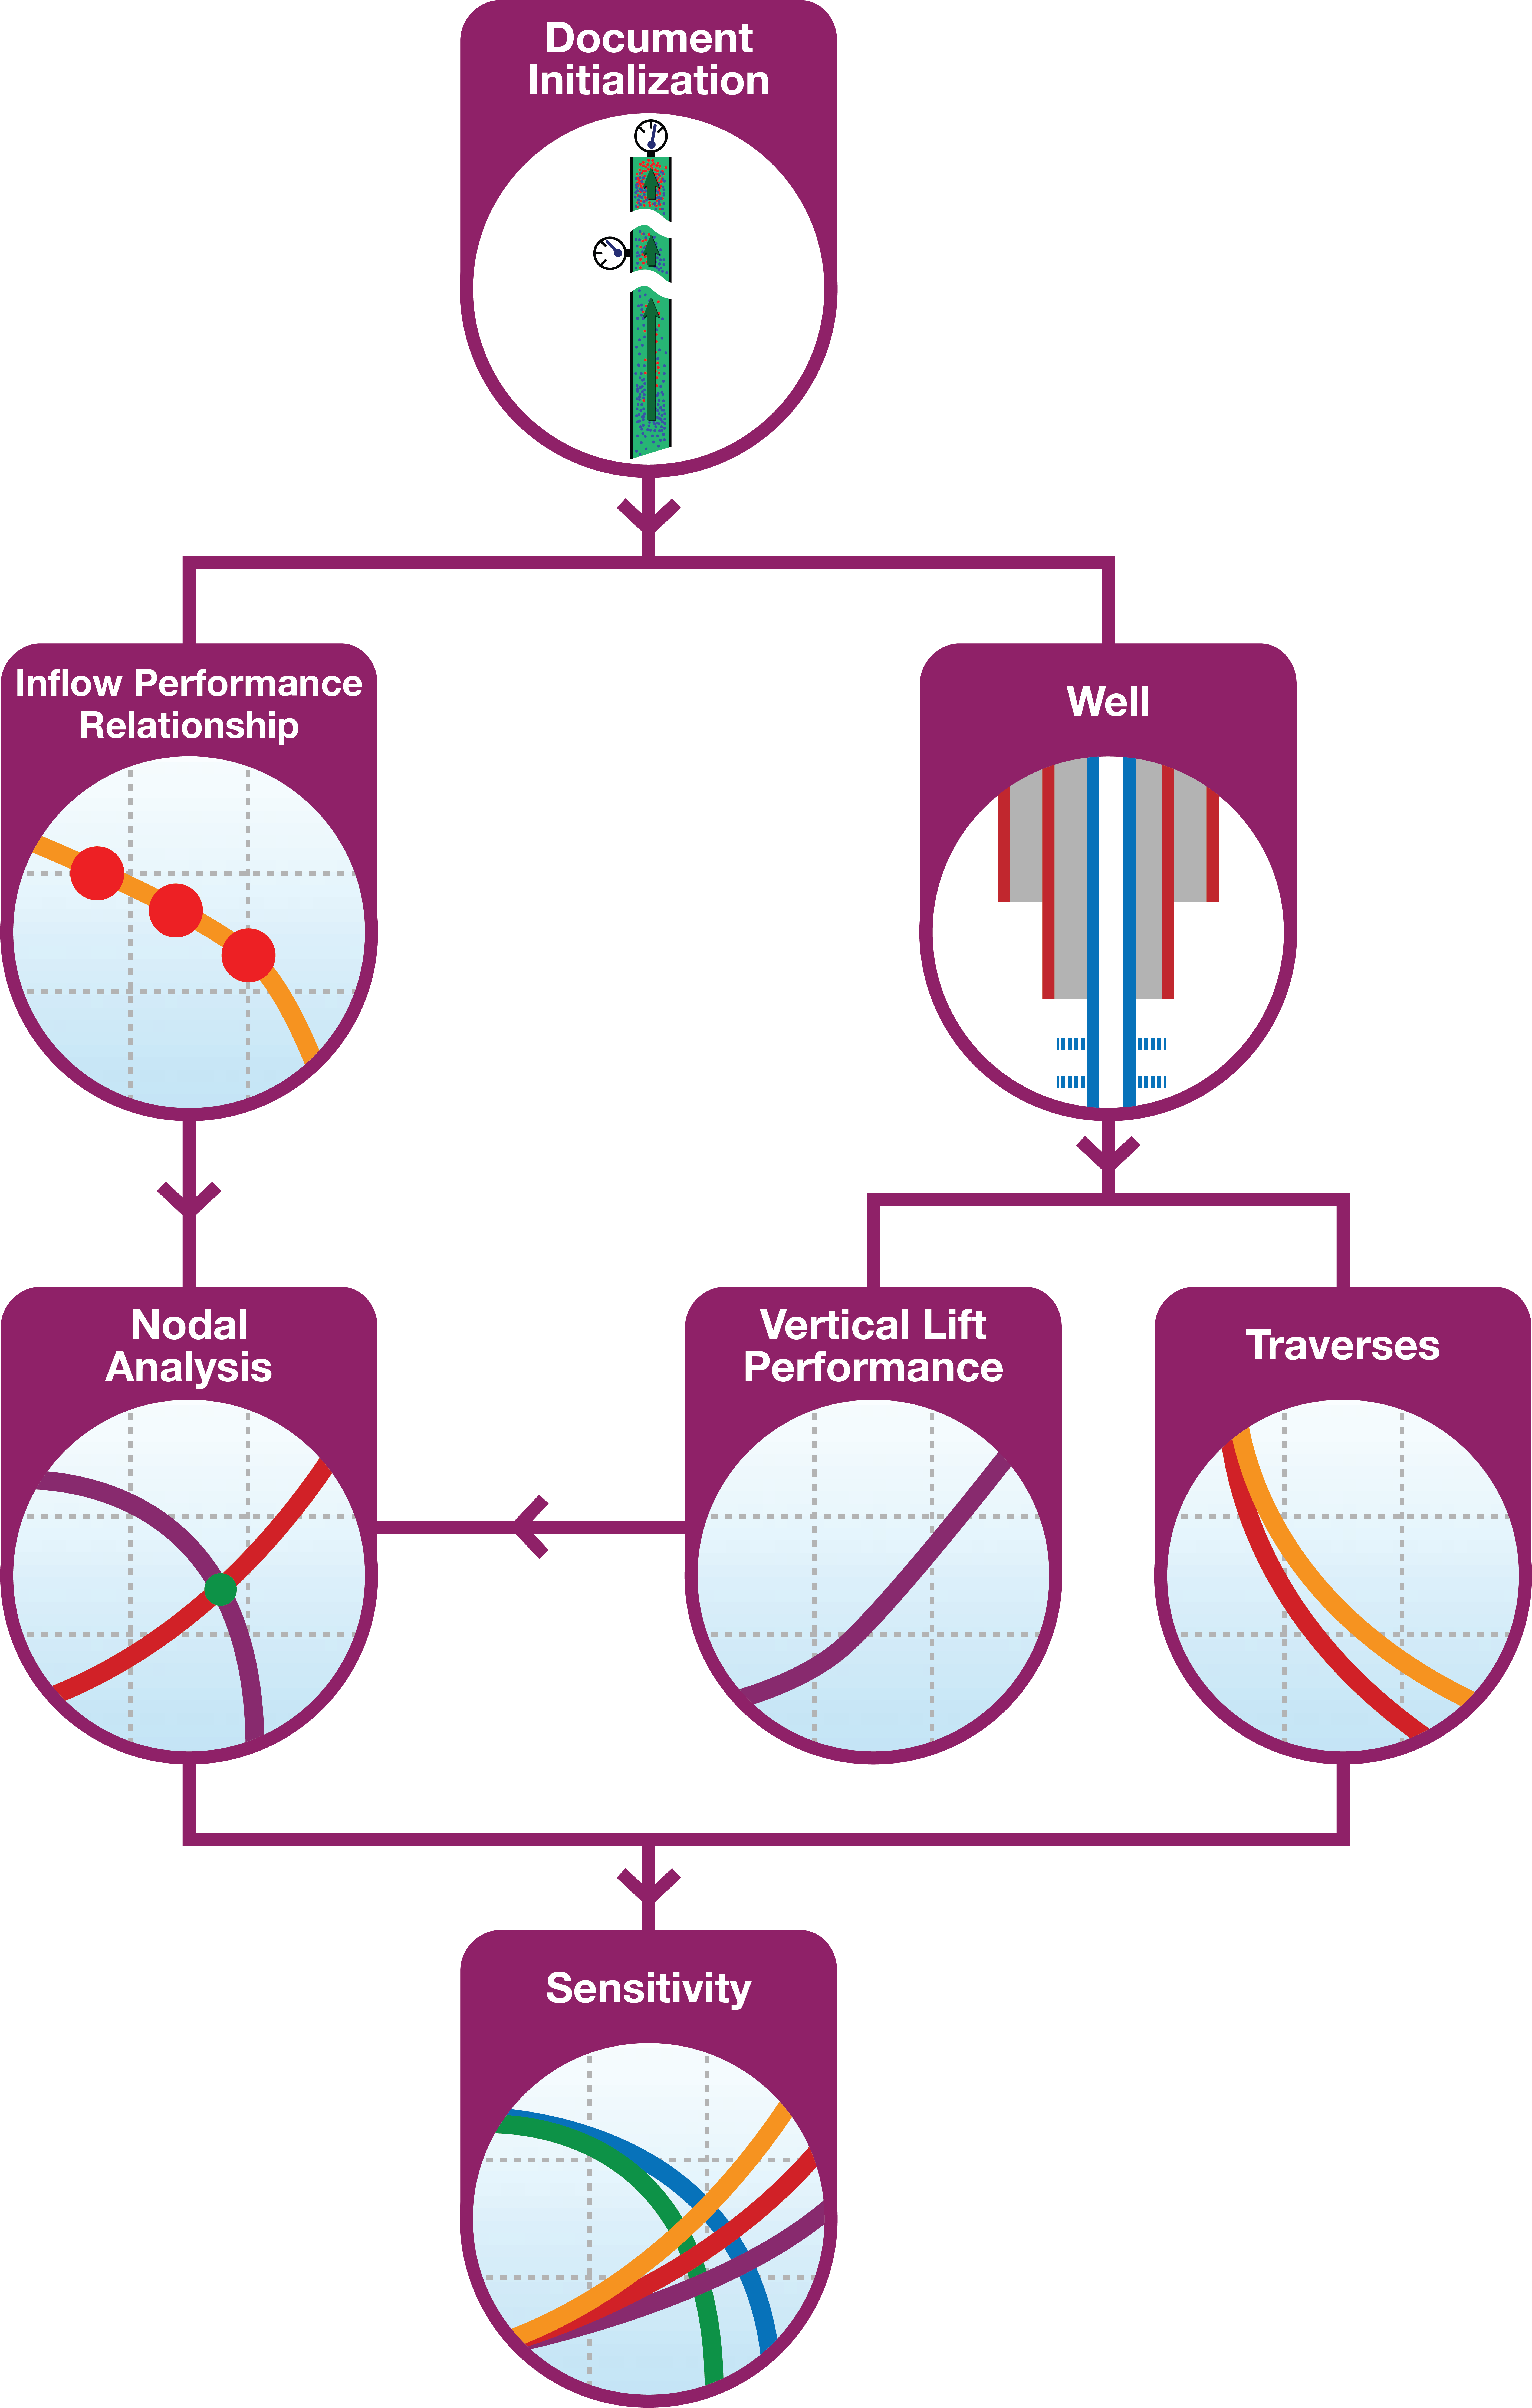
Grenat Workflow

Well Type
Defined as Producer or Injector
PVT
The fluid system can be defined as Black oil, Equation of State (EOS), PVT tables and standard PVT formats (PETEX, Eclipse and IFP).
Completion details
Interactive definition of the well completion using a components library.
Restrictions, IDs, roughness and deviation are defined and considered in the traverse and VLP calculations.
Tubing or annular flow may be selected. The well diagram is displayed in the main interface.
Gas lift: Defined based on the injected gas rate and valve depth. The injected gas may have different PVT properties to the produced gas.
Electric Submersible Pumps (ESP): The pump parameters can be defined either from performance curves, fixed ΔP or fixed power from a built-in catalogue with hundreds of pumps and performance curves.
Equipment design
Chokes: Performance evaluation based on multiple empirical and theoretical models. These can be used to predict the pressure drop, gas and liquid rates, and choke parameters.
ESP design and selection based on production requirements and well constraints.
The temperature profile can be loaded or calculated. The built-in temperature model uses a segmented model incorporating convection, conduction, and thermal compressibility effects.
Flowing Pressure Gradients must be calculated to relate the interaction between surface and bottomhole conditions.
The wellbore is segmented into various intervals, and in each of them, the physical properties of the fluid are computed, together with the hydrostatic, frictional and kinetic pressure drops.
Multiphase Correlations
Empirical and mechanistic pressure drop models are available with the possibility of constraining the traverse calculation based on measured pressure gradients.
Inputs
Traverses are calculated based on surface or bottomhole pressures, and rate definition (individual rates or phase ratios). Multiple scenarios or tests can be generated, with the data loaded manually or from a file.
Miscellaneous
- Any number of calculation nodes can be defined
- Several erosional velocity models available
- Static liquid column for gas cases
- Several panes available to display parameters versus depth including pressure, temperature, velocity, rate, slippage velocity, hold-ups, flow patterns, etc.
Nodal Analysis
Once the VLP and IPR curves are calculated, Grenat displays them on the same nodal analysis or deliverability plot.
The intersect of the two curves is the operating point, which represents the surface rates and bottomhole flowing pressure calculated for the wellhead pressure defined during the VLP calculation.
Variables
Sensitivities to operational, completion and reservoir parameters.
This analysis may generate new IPR, VLPs and traverses, depending on the variable.
Unlimited number of sensitivities per case.
Calculation
The calculation can be based on a single parameter or multivariate scenarios.
Plots
Sensitivities can be generated for the nodal analysis or traverses plots.
A cross correlation between the resulting rates and the sensitivity parameters can be displayed.