Formation testing, or FT, has many applications including formation fluid characterization, pressure measurements and reservoir characterization.
Pressure data can be analyzed as it varies with depth. Multiple pressure measurements are taken in the well to determine fluid density gradients
and potential fluid contacts. With the extraction of the formation fluid, the pressure can also be analyzed as it varies with time, essentially as a
mini well test. Depending on the extent of the tests, reservoir parameters such as permeability, skin and well
deliverability can be characterized.
Azurite offers a tool and service company agnostic environment to process automatically identified raw FT data from any tool and then switching seamlessly between the vs time and vs depth views and analysis.
Although there is full user control, the test types and qualities may be identified automatically, fluid gradients/contacts can be determined and a comprehensive PTA analysis performed.
Azurite Workflow
- Data\nProcessing
- Diagnostic\nTools
-
- Analytical\nModels
- Numerical\nModels
- Zone\ndefinition
- Fluid Gradient Definition
Data loading in KAPPA-Workstation
Azurite can load an unlimited number of stations (vs time) and static passes (vs depth) in LAS, DLIS, LIS, ASCII, Excel, WITSML format, or from clipboard or manually.
If pressure, mobility or density data are available in a tabulated form versus depth, the “User Data” option allows importing this information.
Reference Pressure
An FT tool is run with pressure gauges to record the reservoir response during the test. The reference pressure may be the gauge belonging to the tool module, used during the operation (probe or packer) with higher resolution (quartz vs strain gauges).
Azurite uses the pressure gauge information to compute key pressures (mud pressure, stop and drawdown pressure), the test quality, and identify the test type.
Event type identification
A station may contain different event types. Depending on the objectives of the operation, a variety of events are carried out to read the response of the reservoir (pretest, miniDST, sampling, etc.).
Azurite follows a series of criteria to identify automatically the event type and validity per station. This criteria depends on the reference pressure and the computed rates behavior.
Event quality
Event quality is used to identify the confidence of the events recorded at a station. This range may vary between excellent to low quality events.
Azurite calculates the quality from the pressure standard deviation, the build-up pressure stability, the build-up temperature stability, and the drawdown mobility.
Pf - Mdd identification
An objective of FT is to determine Formation Pressure (Pf). The drawdown mobility (Mdd) is calculated by making the assumption of steady state spherical flow. This mobility depends on the rates, pressure difference and the tool geometry. Additional methods from different service companies (Schlumberger, BHGE, Halliburton) have been implemented as well.
By default, Azurite defines Pf as the last pressure of the test, read on a line obtained by regression over the last 60 seconds of the build-up. As with Pf, mobility is calculated for the Pretest and the Mini-DST tests.
Compute Q
In practice, during an FT operation, the cumulative volume is measured vs time. From this data, it is possible to compute rates.
Azurite calculates rates from volumes. The Compute Q calculation is launched on the station volumes (total volume, VTT) in order to finally get total rate (QTT). The calculation of rates can be performed by simple point-to-point derivative (three point derivative) or either using the first order derivative (Two point derivative).
Real time connection
A new architecture was developed to enable real time connection. The first version of this feature considers the communication with a shared folder, where incremental LAS or DLIS files are updated by the acquisition system with station data.
Analytical models
Azurite offers, a comprehensive built-in analytical catalog combining well, reservoir and boundary models.
Additional capabilities include changing wellbore storage, multilayer, multiprobe (VIT), vertical and horizontal (dual packer only) anisotropy, test design.
Wellbore models
Azurite includes constant as well as changing wellbore storage models to fit early time behavior. Changing storage models include Hegeman, Fair and Spivey.

Well models
To match transient data and depending on the tool geometry, the following well models are available in Azurite:
- Single Probe Model (circular and oval probes) with any deviation
- N-probe model (dual probe, 3D radial and opposite probes with circular or oval geometry) with any deviation
- Dual packer (limited entry) with any deviation
- Uniform Flux & Infinite Conductivity Fracture (any probe, no wellbore effect)
Reservoir models
To match transient data and effects due to the reservoir, the following reservoir models are available in Azurite:
- Homogenous
-
Two porosity
- Pseudo steady state
- Slab model
- Sphere model
- Radial composite
Boundary models
A range of boundaries can be modeled analytically in Azurite including:
- Single fault
- Parallel faults
- Intersecting fault discrete angle
- Rectangle
- Circular
Numerical models
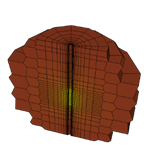
A 3D, unstructured grid, numerical model may be run for dual packer or circular probes. Features include:
- Vertical and deviated wells
- Compatible with both single and n-layer
- Single or multiple probe
- Wellbore fully gridded above and below the perforation and considered as a no flow boundary
- Numerical settings guarantee accuracy and convergence in a very refined environment
- Current version is restricted to single-phase flow
- Test design

Data vs depth plot
In general practice it is common to use open hole log data to identify the 'best spots' where a pressure point or sampling can be taken.
Azurite displays the static passes (e.g. GR, Resistivity, Density, Neutron porosity, etc.) and pressures/mobility vs depth that may help in the identification of different zones/formations.
Additionally, any type of data or PTA results can be displayed vs depth along with any logs available to enhance the quality of the interpretation.
Open hole log data
The open hole logs are very useful for the zone definition, especially the gamma ray tool (GR) where different rock types can be identified.
Open hole logs can be loaded into Azurite for visualization purposes. They may be integrated into a single user track (e.g. Density-Neutron porosity) to assist with interpretation. Templates can be used to invoke a particular order of tracks and group of curves.
Pressure trend
The user can define zones as indicated by pressure trends where open hole logs are otherwise unavailable or not indicating their presence.
Azurite can also identify zones if pressure trends diverge from those expected due to the density of the reservoir fluids.
Pressure vs depth
Running a formation test tool allows the construction of pressure profiles (vs TVD). This data is used to identify fluid gradients and the potential contacts in the reservoir.
After the automatic identification of tests, Azurite selects the higher quality tests per station. The pressure is plotted vs depth and the gradient defined and hence the fluid in situ identified.
Fluid density
When several pressure points along the wellbore exist, a gradient analysis may be performed. The main objective is to quantify pressure variation with TVD which is used to estimate in situ fluid density.
Fluid contacts
In cases where different fluids coexist in the reservoir, pressure points may identify the contacts due to the density difference between these fluids.
In Azurite, the intersection between two fluid gradient lines is identified as a contact displaying its depth and pressure value.
Automatic gradients and zones definition
This option allows defining gradients and flow units accounting for the pressure points available. The operation is conducted following a pre-defined criteria including:
- Points with a minimum acceptable quality
- Removal of outliers
- Standard pressure error on Data Fit lower than on Monte Carlo
- Identify valid contacts from the line intersects
Multi-well
A specific multi-well document can be created gathering the gradient results of several wells, and permitting the modification of the gradient analyses thanks to the shared information.
Gradient statistics and uncertainties
The gradient statistics are available for single and multiwell files:
- Fit Quality
- Linear Data Fit
- Monte-Carlo simulations
- Line similarity
- Pressure Residual
- Excess Pressure