Basic HTML Version


VA – GP - OA: Numerical Multiphase PTA
p 6/29
From any water saturation profile and mobility curves, one can also derive the corresponding
total mobility profile (right side of Figure 6).
Across the saturation shock, a total mobility shock is also experienced. Let us call
r
the
mobility ratio across the front:
wr
t
f
t
S S r
This mobility ratio is responsible for the stability of the displacement process. If the injected
fluid is less mobile
at the front
than the displaced fluid, the ratio
1
r
is said favorable: in this
case, the displacement is stable and viscous fingering cannot develop. If
1
r
, the ratio is
unfavorable: viscous fingering can develop and reduce the sweep efficiency. It is interesting to
notice that while the end-point mobility ratio seems unfavorable in Figure 6, the non-linearity
of relative permeability curves leads to a favorable mobility ratio at the front. As a
consequence, the overall displacement is stable. Stable displacements can hence arise even if
the viscosity of the injected fluid is lower than the viscosity of the fluid in place (King and
Dunayevsky, 1989).
Note that in Test Case 1, tuning the Corey exponent between 1 and 3 was a way to tune the
mobility contrast across the saturation front, and trigger larger oscillations.
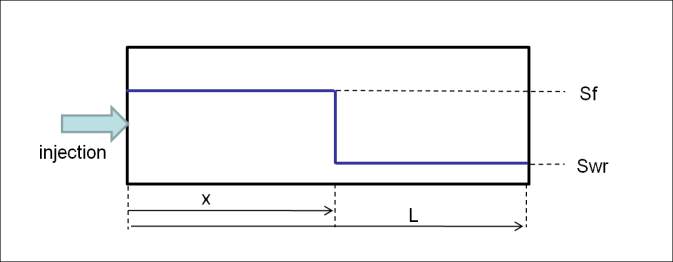
Let us now consider a well-developed 1D injection profile. We focus on a region close to the
front, and assume that upstream of this front (located at x) the evolution of the saturation is
negligible (Figure 7).
Figure 7: 1D displacement with the continuous model
In the continuous model (Figure 7), the pressure drop in the medium can be expressed as:
wr
t
f
t
S
x L
S
x
CP
Above, C is a constant that depends on the injection rate, the flooded section and the
permeability. From this equation, we see that the pressure drop across the distance L is a
continuous linear function of the position of the front.