Basic HTML Version


VA – GP - OA: Numerical Multiphase PTA
p 5/29
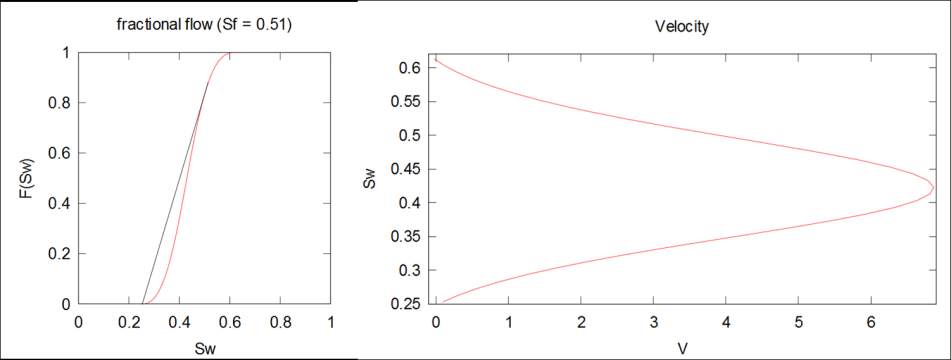
The Buckley-Leverett analysis shows that the fractional flow actually depends on the water
saturation only, and can be expressed:
t
w
w
Sf
Such a fractional flow curve is presented on the left side of Figure 5. Using the method of
characteristics to solve the hyperbolic equation, it can be shown that each saturation plane
travels at its own, constant speed:
w
w
w
dS
Sdf
SV
This leads to the velocity profile shown on the right side of Figure 5. Because low saturation
planes travel slowly compared to some higher saturation planes, a saturation front appears.
The value of the front saturation Sf can be deduced from the fractional flow curve through
Welge’s tangency (left of Figure 5), as developed in Marle, 1981.
Figure 5: Fractional flow and velocity profile corresponding to the curves of Figure 4.
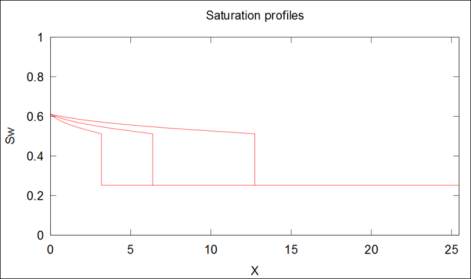
From the front saturation value and from the velocity profile, it is easy to derive the evolution
of the saturation profiles during the 1D flooding of the porous medium. The left side of Figure 6
gives such profiles for three different times.
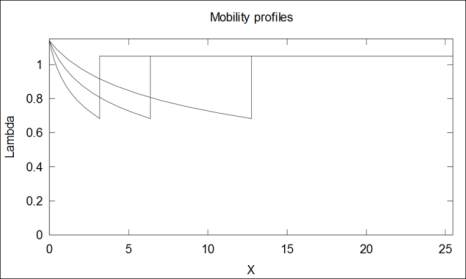
Figure 6: Saturation and mobility profiles at 3 different times,
corresponding to curves of Figure 4