Basic HTML Version


VA – GP - OA: Numerical Multiphase PTA
p 4/29
On the right side of Figure 3, one can see that reducing the cell size increases the frequency of
oscillations, but also reduces their amplitude. This is explained in the next section.
2.2. Origin of oscillations
Let us consider a 1D displacement of oil by water, water being injected at constant rate. Both
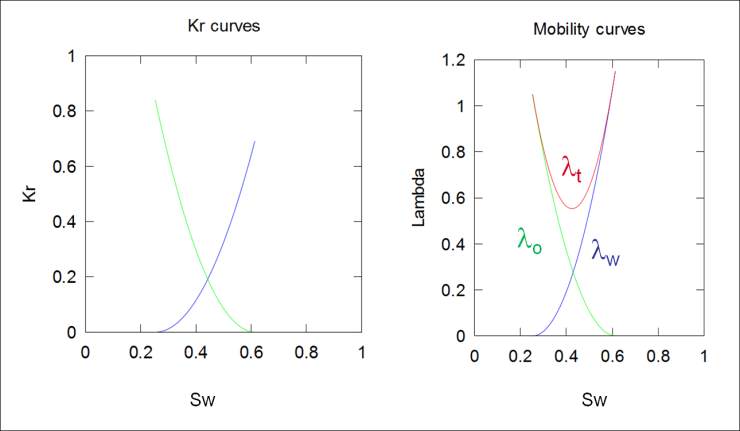
fluids are assumed incompressible. From viscosity values and kr curves, the oil, water and
total mobility curves can be derived:
Such curves are presented on Figure 4. Note that for the sake of illustration in all the figures
below, we used the same viscosity values as in test case 1, with the “Corey 2” relative
permeability curves. It is important to notice that due to the non-linearity of the relative
permeability curves, the total mobility curve is also non-linear. Indeed, as shown on figure 4,
the total mobility starts to decrease when the water saturation increases from S
wr
, before
increasing again as S
w
approaches (1-S
or
).
Figure 4: Relative permeability and mobility curves
Let us know consider the classical Buckley-Leverett model (Buckley and Leverett, 1942, Marle,
1981) to further investigate the problem. With this model, the 1D, incompressible
displacement in the absence of capillary pressure and gravity can be described with the
following hyperbolic equation:
0
t
S
x
S
dS
df
u
w
w
w
Above,
u
is the total velocity,
is the porosity, and
f
is the water fractional flow, defined as:
u
u
f
w