Basic HTML Version


VA – GP - OA: Numerical Multiphase PTA
p 3/29
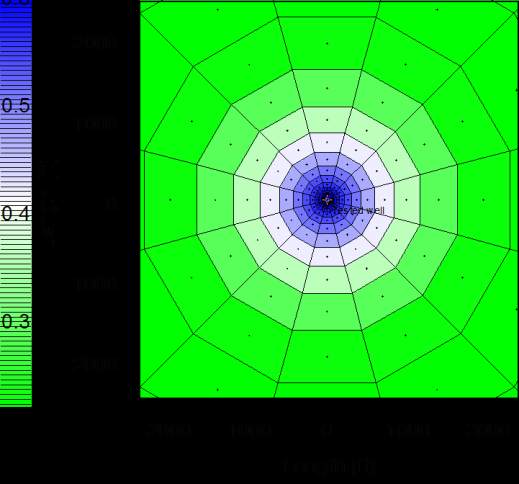
Looking at the evolution of the water saturation field during the injection, we see that every
oscillation on the loglog plot corresponds to the invasion of a new ring of cells by the water
bank (Figure 2). The higher the mobility contrast between the water bank and the initial oil,
the larger the resulting oscillations.
Figure 2: Water saturation map around the well at the end of the injection period
Although the level of the oscillations can be spectacular for strong mobility contrasts (e.g.
Figure 1 for Corey 3 curves), it can be greatly reduced by refining the simulation grid. Figure 3
compares the results obtained using a gridding progression ratio of 1.4 with those obtained
using ratios of 1.2 and 1.1, in the case of very non-linear curves (Corey 3). It is worth noticing
that for weaker contrasts (Corey 1 and 2), the oscillations almost completely disappear with a
gridding progression ratio of 1.2.
Figure 3: Effect of grid refinement on oscillations (gpr = gridding progression ratio)
0.01
0.1
1
10
100
1000
10000
Time [hr]
10
100
Corey 3
Corey 3 refined (gpr=1.2)
Corey 3 refined (gpr=1.1)