Basic HTML Version


VA – GP - OA: Numerical Multiphase PTA
p 28/29
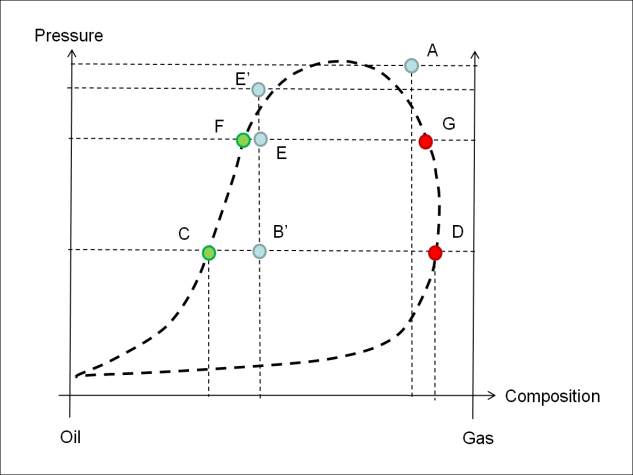
In the real production process, however, the global composition in this area was enriched in
heavy component, as represented by point B’ on figure 42. When recompressed during the
build-up, this new composition does not cross the dew pressure curve anymore, but the bubble
pressure curve. As a consequence, the free gas obtained at the end of the production process
(D) may ultimately dissolve into the oil (point E’).
Figure 42: Pressure-composition diagram
4.3. Conclusions for condensate gas production
The production of condensate gas can be simulated in transient mode using the numerical
model in Saphir, with some specific observable behavior:
During the production, pressure can drop below the dew point and an oil condensate
can appear in the reservoir. The progression of the condensate zone while pressure
drops down leads to strong oscillations on the pressure derivative. These oscillations
are a consequence of the discretization, and can be significantly damped by reducing
the gridding progression ratio. In this case, no correction based on pseudo-kr is
possible, because the condensate saturation cannot be related to an actual front
position.
Oscillations do not prevent the interpretation of the loglog plot. In particular, it is
possible to relate the observable decrease of mobility to the apparition of oil.
Build ups do not exhibit oscillation, and can be interpreted in terms of gas and oil
mobilities
Finally, several complex flow and PVT processes can be analyzed by examining the
evolution of the saturation maps. Such analysis is only possible through the use of a
non-linear, numerical model.