Basic HTML Version


VA – GP - OA: Numerical Multiphase PTA
p 27/29
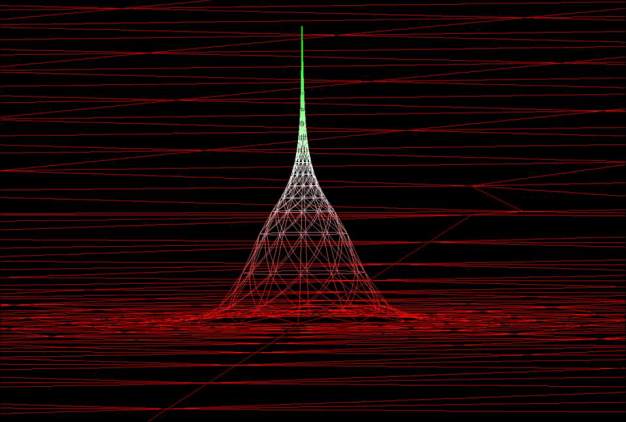
During the build-up, however, a rather non-intuitive behavior can occur, as shown on Figure
40. In this case, the oil saturation in the immediate vicinity of the well increased, and even
reached So=1 at the end of the build-up. This is explained by the fact that the global
composition in this area was enriched in heavy component during the production, as developed
below.
Figure 40: Oil saturation field at the end of the buildup (R=50,000 ft, k=20 mD)
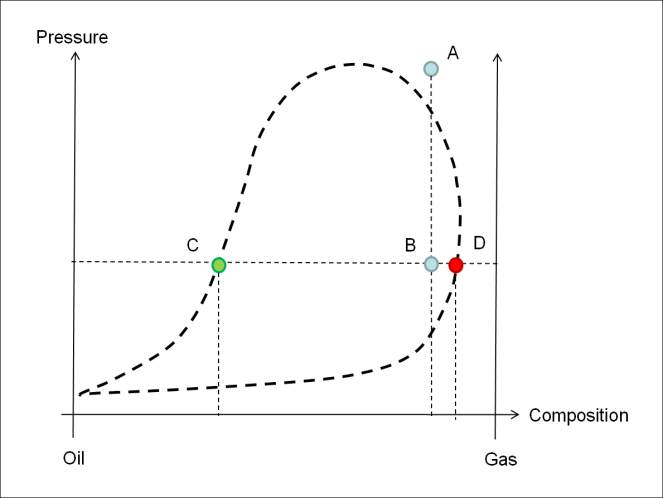
In order to understand this process, let us first consider a constant mass depletion process
(Figure 41). Point A corresponds to the composition of the original gas in place at the initial
pressure. As the gas is depleted to the local pressure (corresponding to the end of the
production phase), an oil condensate appears if the final pressure is below Pd. Oil and gas are
then present in the zone, represented by points C and D. If the pressure comes back to the
initial one during the buildup, all the oil condensate should vaporize (back to point A on the
graph).
Figure 41: Pressure-composition diagram