Basic HTML Version


VA – GP - OA: Numerical Multiphase PTA
p 26/29
Figure 38: Transition toward single-phase mobility during build-up (R=50,000ft, k=10mD).
Late time noise is due to numerical precision
Finally, after 1000 hr, some random noise is visible on the build-up loglog derivative (right part
of Figure 38). This noise is due to numerical precision. Indeed, as the reservoir state becomes
stable, the well pressure stabilizes around its final value, within a given numerical precision.
This precision error leads to small visible derivative changes in this case, as explained at the
end of section 2.4. Note that the noise appears at unrealistic late time, when the pressure field
is fully stabilized, and that increasing the numerical precision made it disappear.
Evolution of the saturation field during drawdown and build-up
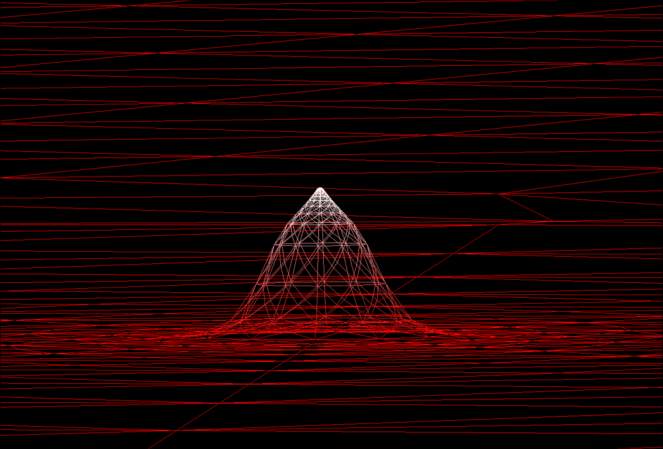
Looking at the oil saturation field at the end of a production phase, we observe an expected
bell-shaped condensate zone in the region where P has decreased below Pd (Figure 39).
Figure 39: Oil saturation field at the end of the production (R=50,000 ft, k=20 mD)
0.01
0.1
1
10
100
1000
10000
1E+5
Time [hr]
100
1000
10000