Basic HTML Version


VA – GP - OA: Numerical Multiphase PTA
p 25/29
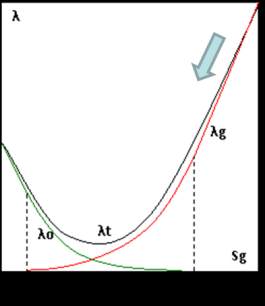
Figure 36: Effect of condensate oil apparition on the total mobility, for constant µ
Let us now consider larger depletions, with R=5,000 ft (Figure 37). In the case k=40 mD, the
initial gas reached the dew point around the well at 1120 hr and at the boundaries around
2,500 hr. On this simulation, the derivative curve of the production period can be easily
interpreted: the pseudo permanent regime is reached around 100 h, and displays a unit slope
until the dew point is reached, at the well first, but soon everywhere. Gas apparition in the
medium introduces a single, strong oscillation.
Figure 37: Evolution of the pressure derivative for various values of permeability (R=5,000 ft)
Build-up analysis
During the build-up phase, the “condensate front” quickly stops progressing. As a
consequence, almost no oscillation is visible on build-up derivatives, except for some precision-
related random noise at late time, as explained below.
The build-up derivative exhibits a transition from the near-well two-phase region toward the
external single phase region representative of the gas mobility. On Figure 38 (R=50,000ft,
k=10 mD), the inner region shows reduced mobility, because the total (gas+oil) mobility is
lower than the single-phase gas mobility.
0.01
0.1
1
10
100
1000
10000
Time [hr]
100
1000
K=40mD
K=10mD