Basic HTML Version


VA – GP - OA: Numerical Multiphase PTA
p 21/29
In the immediate vicinity of the well, the oil is very undersaturated. Moreover, during the
build-up process, the corresponding cells are further fed with undersaturated oil coming from
external cells. As a consequence, while pressure builds up, all the gas can dissolve into oil and
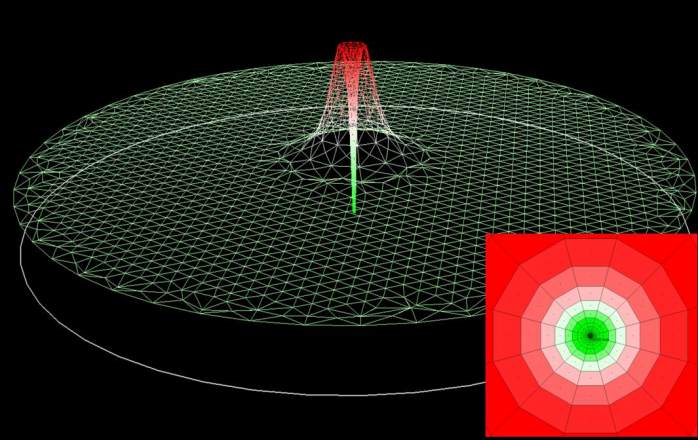
the gas saturation decreases to zero in this area (Figure 30).
However, a less intuitive effect is also visible on this figure: an intermediate zone appears
where gas is still present at the end of the build-up phase. This is explained by the fact that
the global composition in this area was enriched in gas component during the production, as
developed below.
Figure 30: Gas saturation field at the end of build-up (R=5,000ft, k=100mD)
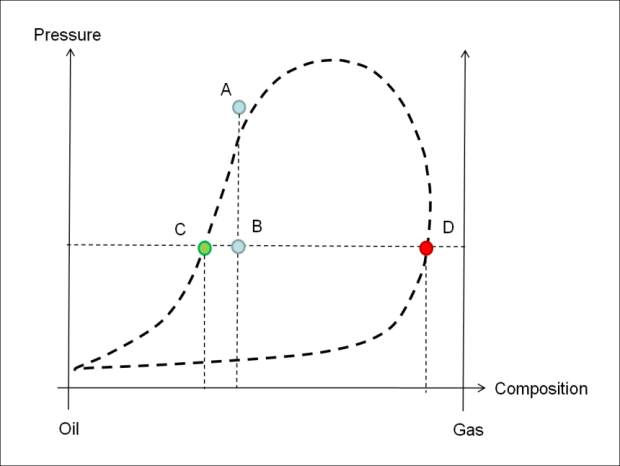
In order to understand this process, let us first consider a constant mass depletion process
(Figure 31). Point A corresponds to the composition of the original oil in place at the initial
pressure. As the oil is depleted to the local pressure (corresponding to the pressure at the end
of the production phase), gas appears if the final pressure is below Pb. Oil and gas are then
present in the zone, represented by points D and C. If the pressure comes back to the initial
one during the build-up, all the gas should disappear (back to point A on the graph).
Figure 31: Pressure-composition diagram