Basic HTML Version


VA – GP - OA: Numerical Multiphase PTA
p 20/29
Build-up analysis
During the build-up phase, the “gas front” quickly stops progressing. As a consequence, almost
no oscillation is visible on loglog build-up derivatives.
The build-up derivative exhibits a transition from the near-well 2-phase region toward the
external single phase region, representative of the oil mobility. On Figure 28 (R=50,000 ft,
k=100 mD), the inner region shows reduced mobility, because the gas saturation is low, so the
total (gas+oil) mobility is lower, as predicted from figure 22.
Figure 28: Transition toward single-phase mobility during build-up (R=50,000 ft, k=100 mD)
Evolution of the saturation field during drawdown and build-up
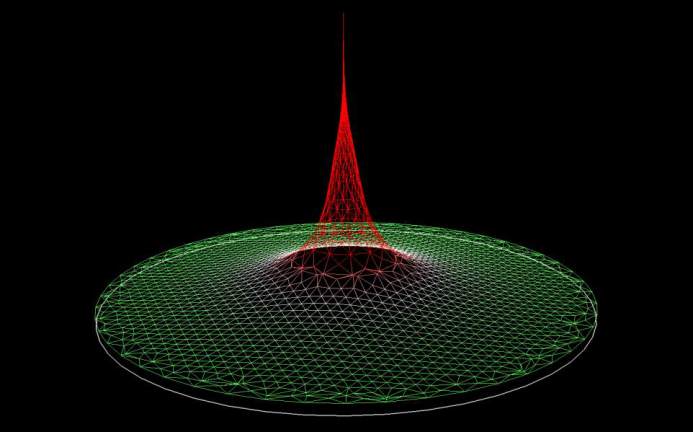
Looking at the gas saturation map at the end of the production phase, Figure 29, we see (as
expected) that the saturation decreases while moving away from the well. It is worth
mentioning again that due to the stabilization of the flowing composition, the saturations
obtained close to the well are higher than what would be obtained from a direct flash of the
initial oil at the local pressure.
Figure 29: Gas saturation field at the end of production (R=5,000 ft, k=100 mD)
0.01
0.1
1
10
100
1000
10000
Time [hr]
100
1000