Basic HTML Version


VA – GP - OA: Numerical Multiphase PTA
p 22/29
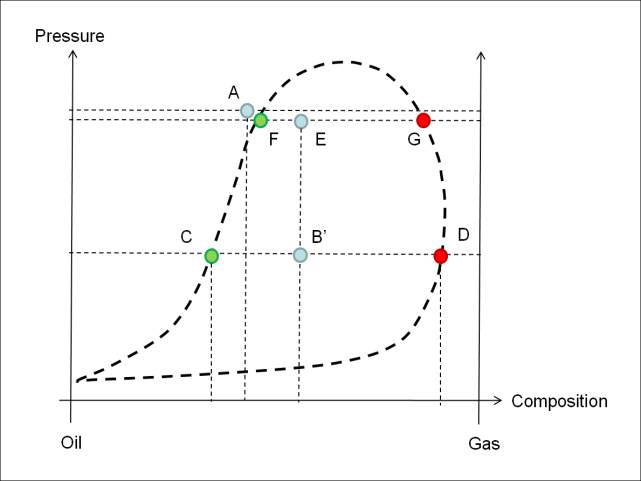
In the real production process, however, the depletion does not correspond to a constant mass
process, and the global composition in this area was enriched in gas, as represented by point
B’ on figure 32. When recompressed during the build-up (E), this new composition is still below
the bubble point, so gas remains present in the system (points F and G), even if the final
pressure is only slightly below the initial one.
Figure 32: Pressure-composition diagram
3.4. Conclusions for black-oil production
The production of black-oil can be simulated in transient mode using the numerical model in
Saphir NL, with some specific observable behavior:
During the production, pressure can drop below the bubble point and gas can appear in
the reservoir. The progression of the gas zone while pressure drops down leads to
oscillations on the pressure derivative.
These oscillations are a consequence of the discretization, and can be significantly
damped by reducing the gridding progression ratio. In this case, no correction based on
pseudo-kr is possible, because the saturation of gas cannot be related to an actual front
position.
Oscillations do not prevent the interpretation of the loglog plot. In particular, it is
possible to relate the observable decrease of mobility to the apparition of gas.
Depending on the depletion level, Sgr, etc… several regimes can be identified: a
pseudo-steady state regime, a regime with increasing compressibility, corresponding to
the increase of gas saturation in the medium, and a regime with higher mobility,
corresponding to the flow of mobile gas everywhere.
Build ups do not exhibit oscillation, and can be interpreted in terms of gas and oil
mobilities.
Finally, many complex processes can be analyzed by examining the evolution of the
GOR or of saturation maps. Complete analysis of these multiphase effects is only
possible through the use of a non-linear, numerical model.