Basic HTML Version


Ecrin v4.12 - Doc v4.12.02 - © KAPPA 1988-2009
Diamant Guided Session #1
•
DmtGS01 - 16/18
From the data browser, select EcrGS01-Pressure and choose the 'View Plot' display mode:
Pressure data are shown as points by default as opposed to the rates that are shown as steps.
Click on the icon
and change the appearance of the pressure data from orange points to
red points, click on the button in the data set properties dialog, and change the screen
appearance to red.
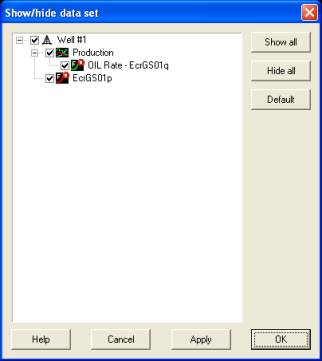
Select the 'Well #1' node and hit the ‘Show/hide
data set’ icon in the toolbar.
This option allows you to select the data set that
you wish to display.
You can either enable ‘EcrGS01-Pressure’ or press
the ‘Show all’ button. Hit OK to confirm your
selection.
The plot is updated and now includes both the oil
rate and the (incomplete) pressure data set as
seen on Figure C01.21.
Fig. C01.21 • View Plot – Well #1
Note:
it is also possible to load data gauges by creating first a mirror that is a replica of the
original data gauge, which will then be used for creating one or multiple filtered data samples
for use in analysis later on, with optimal process speed.
This is very useful when presented with heavy data gauges such as permanent downhole
pressure gauges. For more information, please refer to
chapter C01.3 of EcrGS01 tutorial.