Basic HTML Version


Ecrin v4.12 - Doc v4.12.02 - © KAPPA 1988-2009
Amethyste Guided Session #1
• Ame
GS01 - 10/19
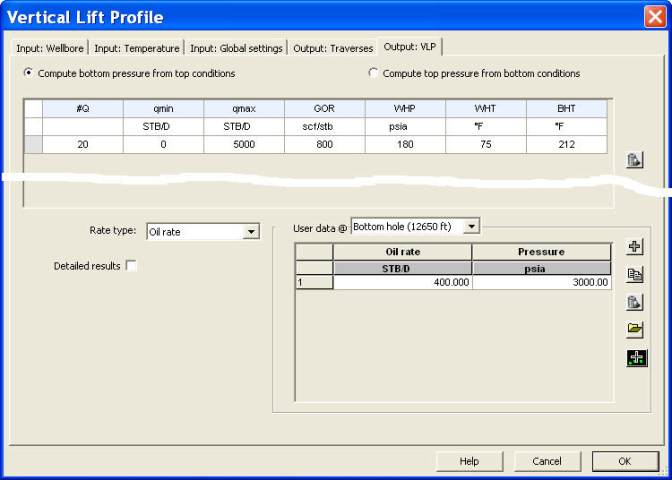
Fig. C01.7 • rate calculation range
The ‘Detailed results’ option forces, for each of the ‘#Q’ production conditions, the output of
the traverses calculations to the activity log. This may help in troubleshooting specific well
conditions. Leave the box unchecked.
In addition, it is possible to specify some measured pressure data for different rates at any of
the calculation node depth. Add the user data Q=
400 STB/D
and P=
3000 psia
at the
bottom hole node. Click on OK.
The VLP plot is created. It shows that if only production Test A was considered, the Stanford
Drift Flux model would be a good candidate for the reference correlation. But Test B has helped
in discriminating both and selecting the best correlation for our well, thanks to the Traverses
calculations.
When the plot is maximised, it is possible to see the VLP curves at any of the calculation nodes
defined earlier, using the Node drop down menu in the toolbar.