Basic HTML Version


Ecrin v4.12 - Doc v4.12.02 - © KAPPA 1988-2009
Amethyste Guided Session #1
• Ame
GS01 - 9/19
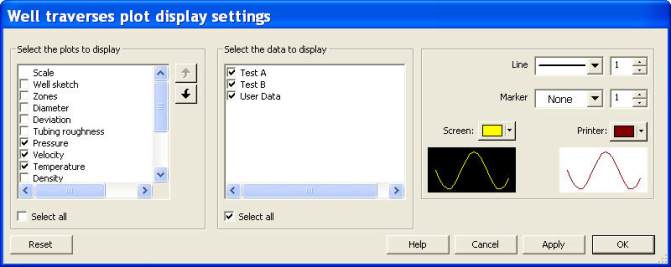
Fig. C01.5 • plots display settings
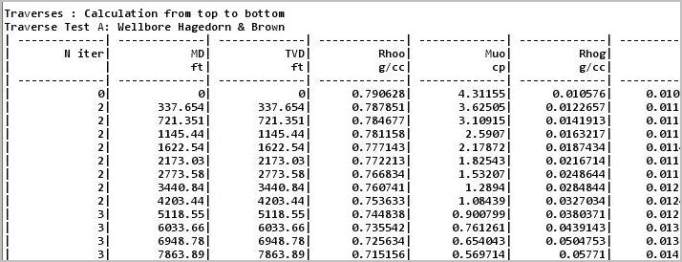
The activity log (tab ‘messages’) located at the bottom of the screen, displays the details of
the calculation during the Traverse tests. To see less detailed messages, go to Settings,
Interpretation, Activity log, select the Amethyste stone and set the verbosity level to a lower
level. This will be effective for the next run.
Fig. C01.6 • detailed messages
Displaying one correlation at a time, by using the Correlation drop down list in the plot toolbar,
it is possible to visually identify the correlation that best matches the entered data for each
production test.
Let’s select ‘Petalas & Aziz’ as the reference. For this, minimize the plot and go back to the VLP
dialog, ‘Input: Wellbore’ tab.
Check the reference box
in front of the
Petalas & Aziz
correlation. This defines the correlation that will be used in the well performance analysis.
C01.5 • Output: VLP
Click on ‘Output: VLP’ in VLP option. This tab is where the Vertical Lift Performance production
conditions are defined. Enter the number of calculation steps (#Q), rate calculation range,
phase ratios, wellhead and bottom hole conditions as shown below (ensure that the rate type
is
Oil rate
):
[#Q: 20, qmin: 0 STB/D, qmax: 5000 STB/D, GOR: 800 scf/bbl, WHP: 180 psia, WHT:
75 °F and BHT: 212 °F]