Basic HTML Version


Ecrin v4.12 - Doc v4.12.02 - © KAPPA 1988-2009
Amethyste Guided Session #1
• Ame
GS01 - 8/19
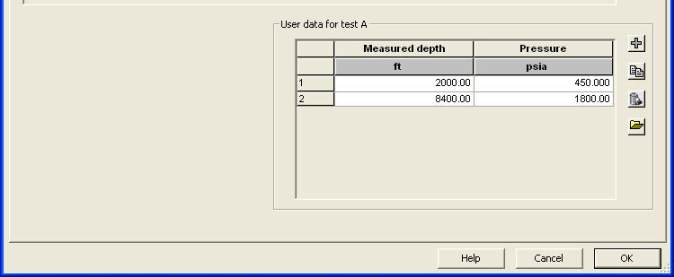
Select each test, and enter the
user data
as follows in the bottom part of the window:
•
Test A: [
2000 ft, 450 psia and 8400 ft, 1800 psia
]
•
Test B: [
4600 ft, 900 psia and 12000 ft, 2500 psia
]
Fig. C01.3 • adding user data
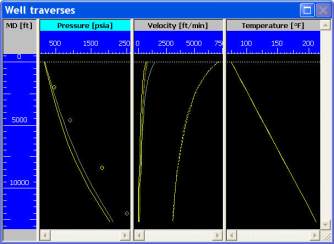
When accepted with OK, the Well Traverses plot is created and displayed on the screen.
Fig. C01.4 • Well Traverses plot
Maximize the plot by double clicking in its header. Curves for both tests A and B are shown.
The velocity plot shows the mixture velocity, the erosional velocity and the unloading velocity.
The curves labels are visible when moving the cursor on the curves.
The Well Traverses plot can display numerous information. Selecting ‘List’ in the Test drop
down menu of the toolbar
or pressing the ‘Edit display settings’
button
opens a window that allows to customize the display to better understand the well
flow. For instance, all well geometrical information can be added to this plot. Depending on the
user choice, these data can be displayed for a given flow correlation and several production
tests, or for a single production test and several flow correlations.