Basic HTML Version


Ecrin v4.12 - Doc v4.12.02 - © KAPPA 1988-2009
Amethyste Guided Session #1
• Ame
GS01 - 6/19
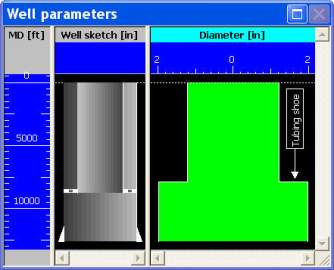
Fig. B01.4 • Well Plot
C01 • Vertical Lift Performance
The next step is the evaluation of the Vertical Lift Performance. The idea is to proceed in two
steps:
1-
Identify the correlation that best represents the flow conditions in the well. It can be
done by determining the flow correlation that best fits in situ pressures.
2-
Use this correlation when achieving the Well Performance analysis.
Click on the VLP icon
. A dialog is displayed, with a series of five tabs allowing the
definition of the outflow model and conditions.
C01.1 • Input: Wellbore tab
The ‘Input: Wellbore’ tab is where the flow correlation(s) applied to the wellbore section must
be defined. Within the list of available correlations press ‘select none’ and after select only:
•
Hagedorn & Brown (ref)
•
Kaya et Al
•
Petalas & Aziz
•
Stanford Drift Flux LG
This will make the plots clearer and the calculations faster. The correlation selected as the
reference is the correlation that will be used when conducting the Well Performance Analysis.
C01.2 • Input: Temperature tab
The ‘Input: Temperature’ tab is where the temperature model applied to the well is selected.
The temperature profile can be selected as linear from top to bottom (‘Linear’), imposed from
a temperature survey (‘Survey’) or simulated based on a geothermal profile and a quantified
heat transfer between the well and the reservoir (‘Calculate’). Keep the default choice to force
a
linear temperature
profile. The end-points temperature will be entered further, in the
‘Output: Traverses’ and ‘Output: VLP’ tabs.