Basic HTML Version


Ecrin v4.12 - Doc v4.12.02 - © KAPPA 1988-2009
Rubis Guided Session #4
• Rub
GS04 - 13/15
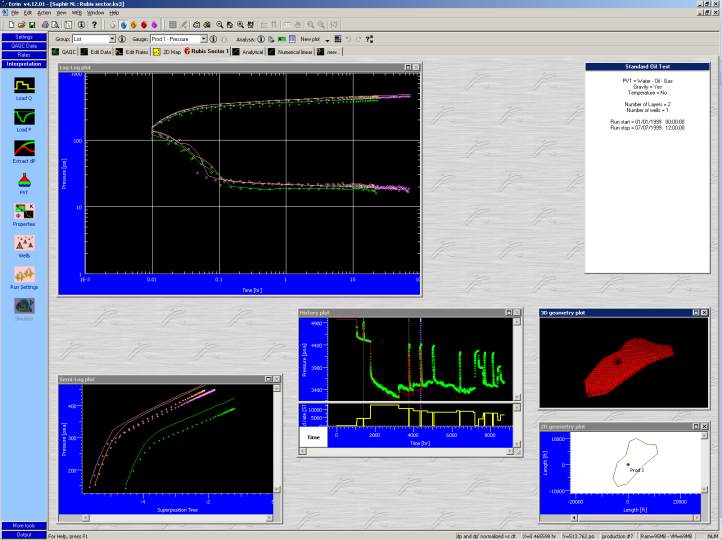
A few remarks can be drawn from this comparison:
-
As noted before, the analytical model is unable to reproduce the long-term declining
trend visible on the pressure data because its model is infinite acting: quite clearly the
reservoir average pressure is dropping.
-
On the other hand, the numerical linear model (based on the sector contour) exhibits a
declining trend that occurs to be too strong: the reservoir size is underestimated in this
case. In fact, it is clearly visible that the sector is only a region of the whole reservoir.
The sector that has been dragged from Rubis is appropriate for near-well (skin) and
intermediate (permeability, first boundaries) interpretation, but it cannot replace the full
history match built in Rubis – unless the sector is built from the complete reservoir.
Let us now go back to the Rubis sector analysis, and change the well skin value from 0 to 2.15
– the value obtained in the linear models (edit the perforations of the Prod 1 well, as you
would do in Rubis). Then, visit the Settings dialog again and exit with OK to enable the
Simulate button. Click on Simulate and wait until the new model is completed:
Fig. B02.11 • Rubis sector model with a skin of 2.15
The model reproduces now more closely the features visible in the log-log plot (compare with
Fig.B02.5).