Basic HTML Version


Ecrin v4.12 - Doc v4.12.02 - © KAPPA 1988-2009
Rubis Guided Session #4
• Rub
GS04 - 3/15
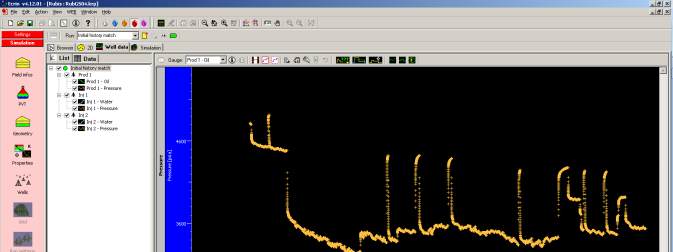
Production shut-ins are present throughout the well history – for instance 8 buildups are visible
during the year 1999, as can be seen in the Well Data page
1
:
Fig. B01.4 • Looking at the first year of production of “Prod 1”
in the Well Data page: 8 buildups are clearly visible
In the following, we will import the buildup measurements in Saphir and perform a
rudimentary well test interpretation in order to better understand the flow behavior around the
well Prod 1, and possibly use its outcome to improve the history match. The Saphir
interpretation file will be automatically created by the Rubis sector to PTA option.
B01.2 • Creating the Rubis sector file
Move to the 2D tab and create a composite limit in order to define a region around the well
Prod 1:
Fig. B01.5 • 2D view of the reservoir before (left) and after (right)
the creation of the composite limit
1
Although the rates are provided as ‘daily rates’ in this exercise, it is implicitly assumed that
they have been already corrected for shut-ins, so that no time synchronization problem will be
encountered later in Saphir.