Basic HTML Version


Ecrin v4.12 - Doc v4.12.02 - © KAPPA 1988-2009
Rubis Guided Session #3
• Rub
GS03 - 22/22
Fig. C01.6 • Comparing the Producer surface pressures simulated in all scenarios
Repeat the same operations with the total reservoir oil cumulative production (Qo node
contained in the Global Results container of each run), to obtain the final display:
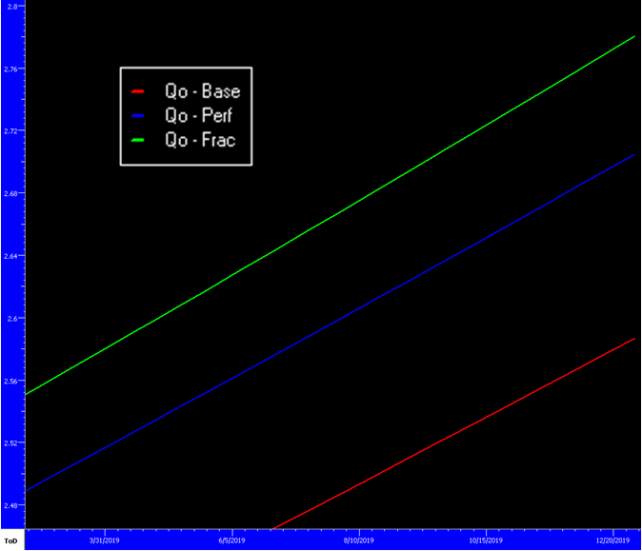
Fig. C01.7 • Comparing the total cumulative oil production simulated in all scenarios
As can be seen above, the “Frac” scenario results in a production increase of approximately
193,000 STB, while the “Perf” scenario leads to a lower production gain of 112,000 STB.