Basic HTML Version


Ecrin v4.12 - Doc v4.12.02 - © KAPPA 1988-2009
Rubis Guided Sessio
• Rub
GS03 - 21/22
n #3
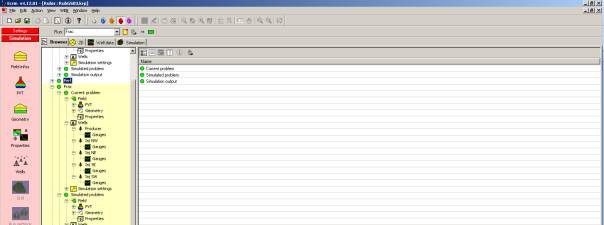
Fig. C01.5 • Rubis browser tab
Expand the various browser nodes as displayed on the
right and select the “qo (surface)” node of the
“Producer” well in the “Simulation Output” of the “Base”
simulation.
Drag and drop it to the “Data store”, in order to create a
copy of this result gauge.
Proceed similarly to drop the “qo (surface)” simulated
gauges of the “Perf” and “Frac” runs into the “Data
store”.
The “Surface Rate” node of the “Data store” will now
contain the 3 gauges:
In the Data store select the “qo (surface) – Base – Producer” and edit its properties with the
right-hand side toolbar button. Change its screen color to red in the “Aspect” tab. Change
the screen color of the respective surface rate nodes to blue and green, for “Perf” and “Frac”
runs. Select the main “Data store – Surface rate” container and click on to visualize all
curves graphically: