Basic HTML Version


Ecrin v4.12 - Doc v4.12.02 - © KAPPA 1988-2009
Ecrin Guided Session #1
• Ecr
GS01 - 29/37
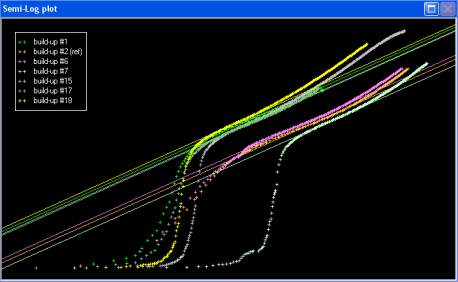
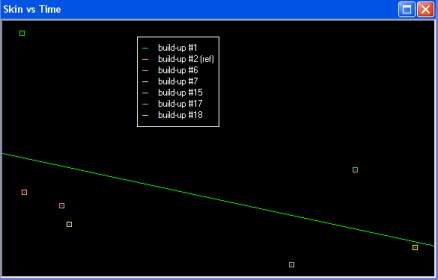
A plot of Skin versus Time is displayed that can be used to evaluate the change of the well
potential over time. Right click on the plot and select ‘Line - Show’ and ‘Average – Show’ to
display the straight lines. Figure E01.6 is the Semilog plot and Figure E01.7 is the plot of Skin
versus Time, after deletion of one point.
Fig. E01.6
• Semilog plots
Fig. E01.7
• Skin versus Time
The skin deduced from the straight line on few Build-up are off and they can be removed from
the line calculation by clicking on them an specifying not to use them in the least square line
calculation.