Basic HTML Version


Ecrin v4.12 - Doc v4.12.02 - © KAPPA 1988-2009
Ecrin Guided Session #1
• Ecr
GS01 - 28/37
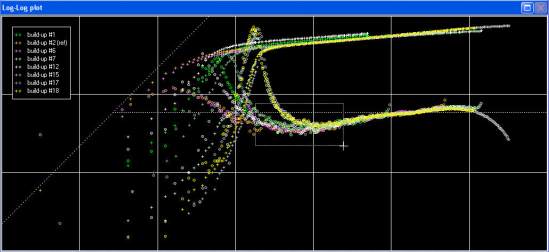
When extracting multiple build ups on the loglog plot, sometimes it is difficult to distinguish
among all the plots the one that we would like to observe. In that case, the user can use the
‘pick’ option to highlight the wanted build up. Maximize the loglog plot, click on in the
toolbar above, and select for example build up #15 (grey) as shown in the figure below.
Fig. E01.4
• Loglog of multiple extracted periods showing the highlighted BU#15
Right click in the loglog plot and choose from the 'Line' option, the 'Multiple + vs. time' and
'Select range', as shown in the figure E01.5. The range to select is indicated by the white
square (click and drag) in the loglog plot of this Figure.
Fig. E01.5
• Multiple straight lines (vs. time + Select Range)
Two distinct options exist to draw lines simultaneously on a set of extracted build-ups: 'All', or
'Select Range'. When using the 'All' option, a time range is specified and Saphir runs a non
linear regression on each build-up in turn.
When using 'Select Range', the process starts in the same manner, then any build-up with a
deduced kh leading to a derivative level outside the specified box is discarded. For the valid
build-ups, a non linear regression is run imposing a unique slope, and one intercept per period.