Basic HTML Version


Ecrin v4.12 - Doc v4.12.02 - © KAPPA 1988-2009
Rubis Guided Session #2
• Rub
GS02 - 6/16
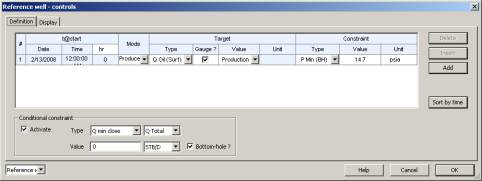
As in Topaze, the Rubis simulation was performed with the oil surface rate gauge used as a
target, as can be seen in the “Wells – Controls” dialog (called from the “Wells” button in the
“Simulation” panel):
Fig. B01.9 • Target and constraint for the reference well
The pressure comparison on the other hand is at surface, whereas the Topaze history plot
showed downhole values. More precisely, the original Topaze file showed a match between the
simulated downhole pressure, and the data corrected to downhole conditions using the defined
Intake model. What we compare in Rubis is the actual surface pressure, with the Rubis
simulated equivalent. While the Rubis reservoir and wellbore model are the same as in Topaze,
the Topaze production is (only) single phase oil, whereas the Rubis production is multiphase.
The distinct production will obviously drive a different pressure drop, explaining the difference
in surface pressure:
Fig. B01.10 • Single phase model in Topaze (left)
compared to the multiphase model in Rubis (right)
Save the current Rubis file as “RubGS02.krp”.