Basic HTML Version


Ecrin v4.12 - Doc v4.12.02 - © KAPPA 1988-2009
Rubis Guided Session #1
• Rub
GS01 - 30/33
Click on
in the plot toolbar. In the
following dialog choose to display only the
surface oil, water and gas rates, along with
the surface pressure:
The curves remaining on the screen show
that water breaks through at the producer
after about 21200 hrs (883 days) of
production:
C03.3 • Looking at Field Results
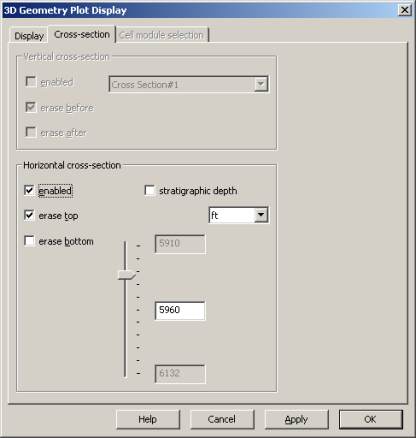
Maximize the 3D Geometry plot, and display the initial pressure field by selecting the first
output time ( in the plot toolbar). Click on to access the plot display settings, and in the
“Cross-Section” tab choose to cut the reservoir along a horizontal plane at a depth of 5960 ft:
Fig. C03.3 • 3D Geometry plot display settings