Basic HTML Version


Ecrin v4.
Guided Session #1
• Rub
GS01 - 29/33
12 - Doc v4.12.02 - © KAPPA 1988-2009
Rubis
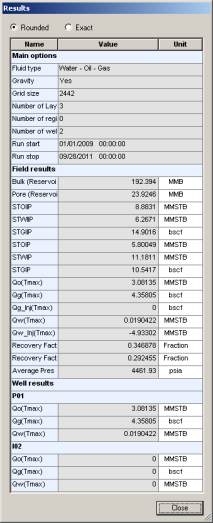
Fig.C03.1 • Simulation status window (left) and Main Results (right)
C03.2 • Looking at Well Results
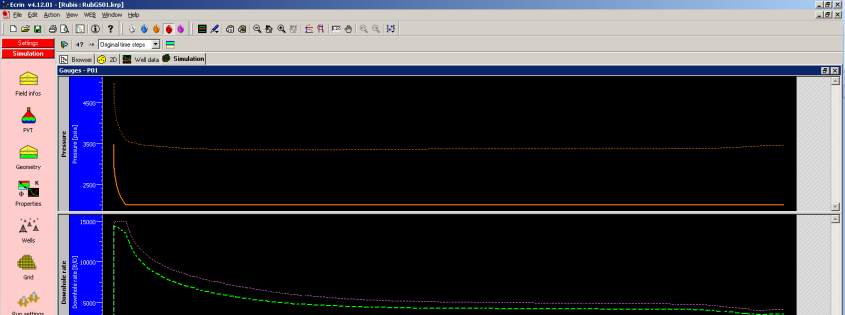
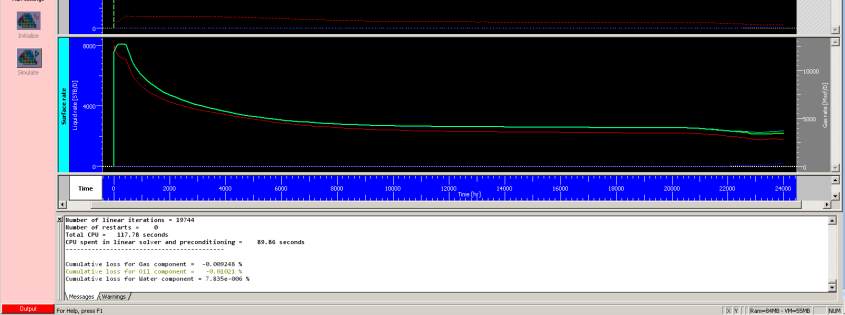
Two specific plots (“Gauges – P01” and “Gauges – I02”) contain the evolution of pressure and
rates simulated at the wells. Maximize the “Gauges – P01” plot:
Fig. C03.2 • P01 output gauges