Basic HTML Version


Ecrin v4.12 - Doc v4.12.02 - © KAPPA 1988-2009
Saphir Guided Session #6
•
SapGS06 - 3/7
Fig. B01.3 • Relative permeabilities vs water saturation
It is possible to interactively change the relative permeability curves at the click of the mouse
by dragging the handles (yellow squares) on the curves.
B01.3 • Defining the 2D Map and the wells
Click on the tab
to access the 2D Map.
Now add a vertical well at coordinates (-
3000 ft, 0
), use the
icon to place the well
approximately. Double click on the well and set the coordinates exactly.
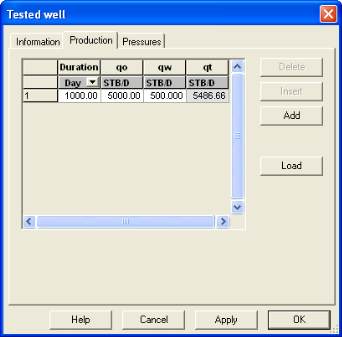
Double click on the tested well to define the production history. Click on the tab 'Production'
and hit once 'hr' in the Duration column to display the combo box that will allow you to select
'Day'. Enter
1000 days
of
Oil rate = 5,000 STB/D
and
Water rate = 500 STB/D
.
See Figure B01.4 left.
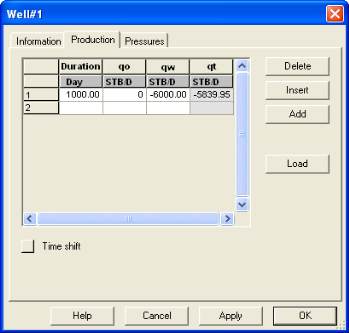
Double click on Well# 1 and specify it as an injection well by entering a negative water rate.
Enter the same duration as the 'Tested well' and a
Water rate = -6,000 STB/D
and no Oil
production See Figure B01.4 right.
Fig. B01.4 •
Tested well & Well#1 productions