Basic HTML Version


Ecrin v4.12 - Doc v4.12.02 - © KAPPA 1988-2009
Saphir Guided Session #1
• Sa
pGS01 - 5/12
Click
to
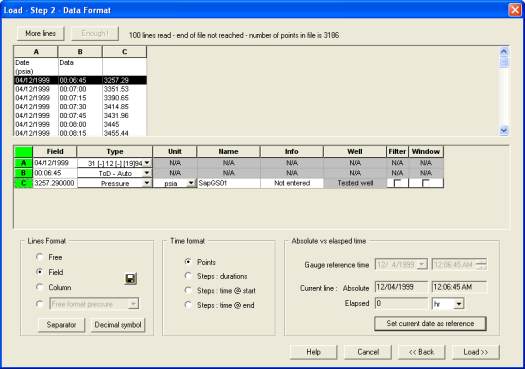
the date, the second column contains the real time (ToD) and the third column is listing the
man
elec
option in the Lines Format section. A spreadsheet like display is shown
containing the data separated in three columns. Under the header
go to the Data Format dialog. Saphir has automatically recognized the file
as valid, but the automatic interpretation of the format is not correct, the first column contains
pressure. Thus you need to
ually specify the format.
S t the
Field
you can
define the various field types by choosing from the droplists. The type of the first field is Date
(DD/MM/YYY)
, the second is
ToD - Auto
and the lasts field
. The
pressure file is in
Points
mode.
is the value,
Pressure
Fig. B01.5 • Load pressure Step 2 – Data format
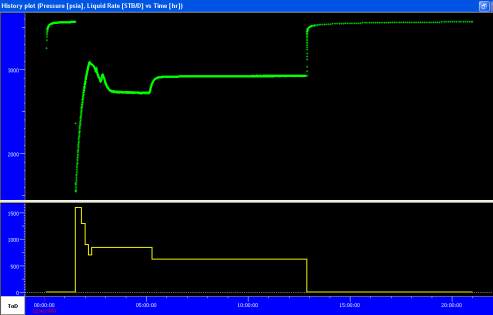
Click on
to load the pressure file. The history plot contains now both the flowrate
and the pressure file. Figure B01.6.
Fig. B01.6 • History plot
The pressure shows that the test is a simple DST, starting with some static pressure followed
by a slug as the fluid rises in the well. Then finally flowing at surface, followed by two
drawdowns on different choke sizes and a final buildup. The buildup is subject to the pressure
transient analysis in this session.