Basic HTML Version


Ecrin v4.12 - Doc v4.12.02 - © KAPPA 1988-2009
Saphir Guided Session #1
• Sa
pGS01 - 4/12
Click on
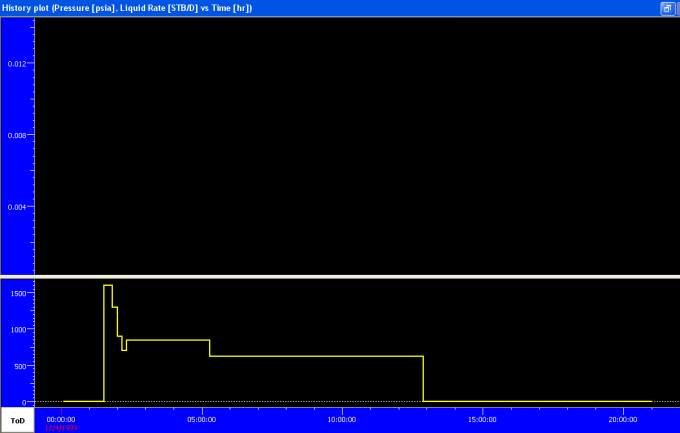
to load the flow rate file. A history plot with the loaded flowrate file in
steps is displayed. Double click in the title bar of the plot to maximize it and display the scales.
A click on the time button
in the time scale will change the scale to real time (ToD) as
defined with the reference date and time at startup. Minimize the plot.
Fig. B01.3 • Loaded flowrates
B01.2 • Loading pressure
Click on the icon
.
e
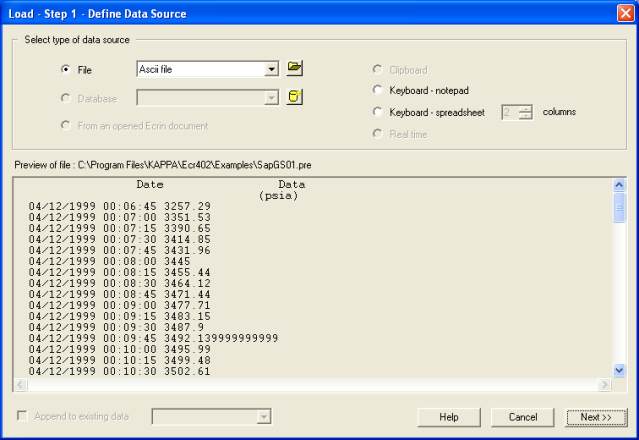
This will initialize the pressure load process. Specify an ASCII file in
the 'Define data sourc ' dialog and click on to browse to the file SapGS01.pre in the
Example directory. A preview of the file will be shown in the dialog as illustrated in Figure
B01.4.
Fig. B01.4 • Load pressure Step 1 – Define data source