Basic HTML Version


Ecrin v4.12 - Doc v4.12.02 - © KAPPA 1988-2009
Saphir Guided Session #1
• Sa
pGS01 - 6/12
xtracting d
C01 • E
elta P
The next natural step is to extract the buildup pressure to the loglog plot, compute the Bourdet
derivative to be displayed together with the delta P to aid the interpreter to choose the model
that may finally match the data and yield the results.
Click on the icon
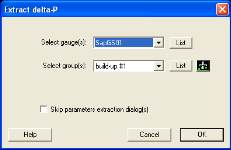
. The first dialog is to choose the period to be extracted, in this case
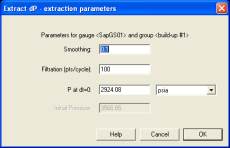
'build-up #1'. The second dialog is to set the derivative smoothing,
oints/log
cycle) and the starting pressure (P at dt=0, often also called Pwf), the default value of the
pressure has been chosen by Saphir as the nearest pressure point to the change in flowrate
(when the flowrate goes to zero for
the filtrations (p
the buildup). Stay with the default values and click OK.
Fig. C01.1 • Extract dialogs
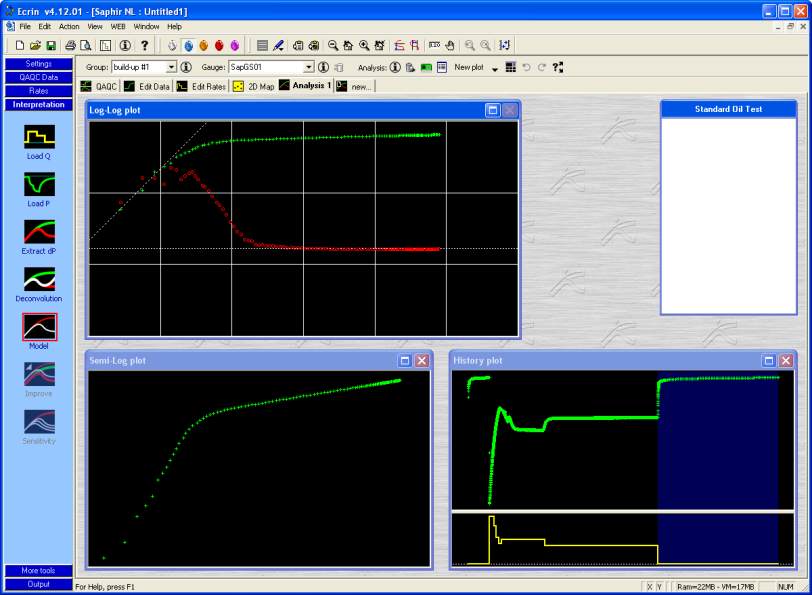
Now
the Saphir screen contains two new plots; the loglog and the semilog plot. Figure C01.2.
Fig. C01.2 • After extract