Basic HTML Version


Ecrin v4.12 - Doc v4.12.02 - © KAPPA 1988-2009
Ecrin Guided Session #1
• Ecr
GS01 - 31/37
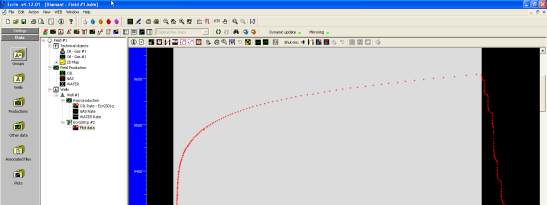
Fig. E01.9
• Selecting the Build-up # 1
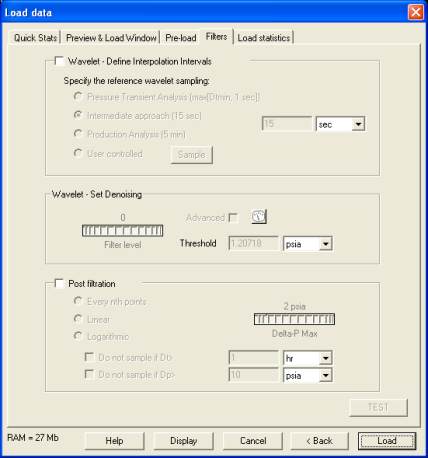
Fig. E01.10
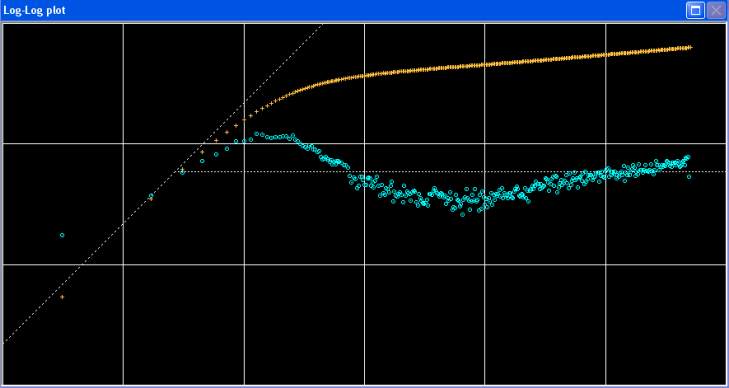
• Partial re-load with no filter
No noticeable difference is seen in the shape of the derivative other
than added noise, Figure E01.11. The wavelet filter, as we set it
originally, did capture the characteristic features of the response while
significantly reducing the number of points and thus eliminating the
noise. So in the Saphir document, we can safely revert the analysis
pressure to the first gauge (Fltd data Backup), see opposite.
Fig. E01.11
• Build-up#2 with all the raw data
In addition to the pressure depletion observed in the history plot, with the radial flow line
(white dotted line on the loglog) placed as illustrated in Figure E01.12 the diagnostic is quite
straightforward: the system is closed and the well is near two faults much closer to the well.