Basic HTML Version


Ecrin v4.12 - Doc v4.12.02 - © KAPPA 1988-2009
Rubis Guided Session #2
• Rub
GS02 - 15/16
The plot clearly shows a pressure difference between the upper and lower layers in the vicinity
of the well during the build-up, explaining the simulated crossflow. Note as well that the dead
zone (Layer 2) is ignored by the simulation 3D grid.
B02.4 • Copying the Model results Back to Topaze
Get back to the initial Topaze document by clicking on in the main Ecrin toolbar.
Re-extract the Topaze production without well
intake correction – to achieve this, click on
“Extraction” in the “Analysis” page and uncheck
the “Use intake” box:
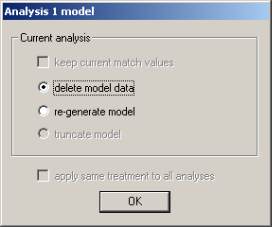
In the following dialog chose to delete the model
data:
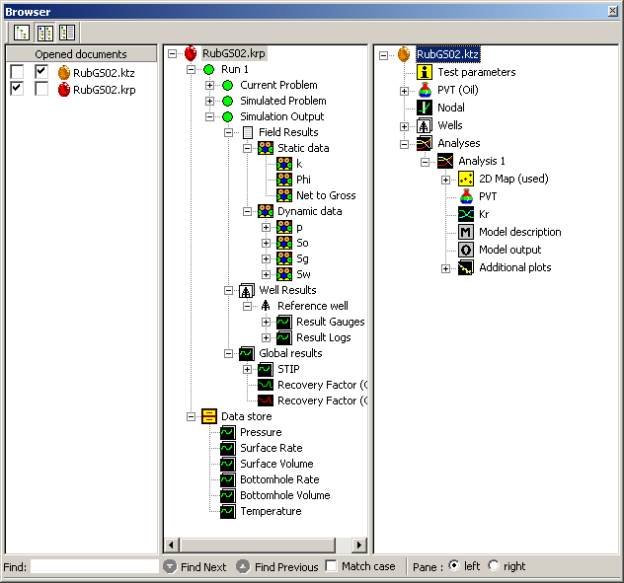
Open the Ecrin browser ( ) from the main Ecrin toolbar, and develop the “Simulation Output”
node on the Rubis side, and the “Analysis” node on the Topaze side:
Fig. B02.13 • Ecrin browser