Basic HTML Version


Ecrin v4.12 - Doc v4.12.02 - © KAPPA 1988-2009
Rubis Guided Session #2
• Rub
GS02 - 14/16
Maximize the 2D Geometry plot and draw a cross-section passing through the well –
button in the plot toolbar:
Fig. B02.11 • Drawing a cross-section in the 2D Geometry output plot
Restore the plot to its previous size and use the
“New plot” menu to create a new Cross Section
plot:
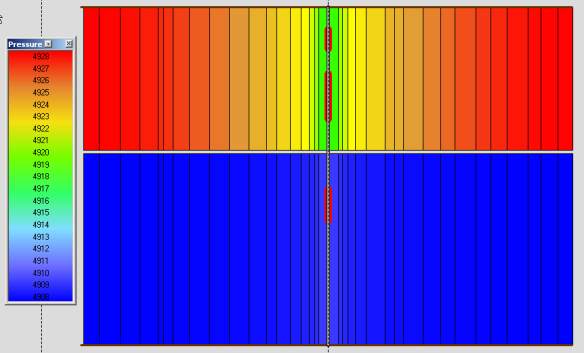
Maximize the Cross-Section plot, choose to display the last pressure field by selecting “p” as
the property to be displayed and by clicking on
to visualize the last field – select also to
display the colorscale with after having reset the min-max with :
Fig. B02.12 • Cross-Section plot, pressure field at 1500 hrs