Basic HTML Version


Ecrin v4.12 - Doc v4.12.02 - © KAPPA 1988-2009
Rubis Guided Session #1
• Rub
GS01 - 8/33
After this step has been completed, the “Reservoir – Geometry” dialog should now display the
following parameters – or something fairly close:
Fig. B02.8 • “Reservoir – Geometry” dialog after the input of all data
Note that the numbers being displayed in the Value column of the table are obtained from a
simple arithmetic average of all points when the horizon is defined as a Data Set. As a result,
you should retrieve the very same numbers for the Sand–top and Shale–thickness lines,
whereas the value for the Sand-thickness line will depend on the number of points you picked
to define the last horizon.
Click on OK in the reservoir geometry dialog to confirm the current layer definition.
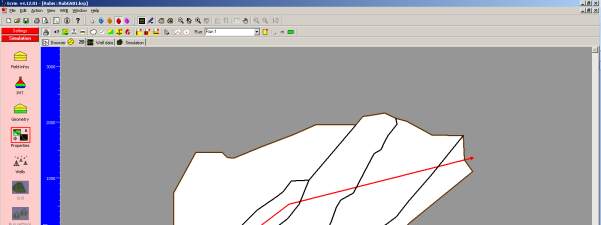
B02.3 • A First Preview of the Reservoir Geometry
Before moving on with the definition of the reservoir properties, we are going to visually check
the defined geometry. The 2D Map already displays a top view of the field that can be
completed by an unlimited number of vertical cross-sections. Click on the
button in the
2DMap toolbar to create a vertical cross-section in a South West – North East direction by
drawing a multiple line (like a fault) double-click to finish:
Fig. B02.9 • Cross-section created in the 2DMap