Basic HTML Version


Ecrin v4.12 - Doc v4.12.02 - © KAPPA 1988-2009
Topaze Guided Session #3
•
TopGS03 - 15/16
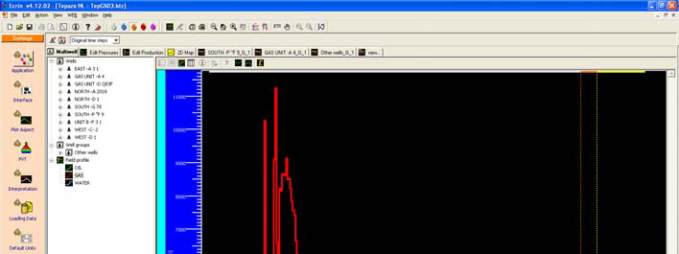
Then choose to build the field forecast from the models of analyses ‘GAS UNIT-A 4_G_1’ and
‘SOUTH-P”F 9_G_1’ and from the Arps plot of analysis ‘Other wells_G_1’, as shown below:
Fig. B05.2 • Selecting the sources used for field profile construction
The simulation range of both models is then reset to red, meaning that the models do not
extend yet until 2002. In fact no forecast has even been simulated in the analysis ‘GAS UNIT-A
4_G_1': in practice the last recorded history pressure will be extended until the end of the q(p)
simulation. Note that all coverage flags remain green, meaning that each well is included in the
field profile, and included only once.
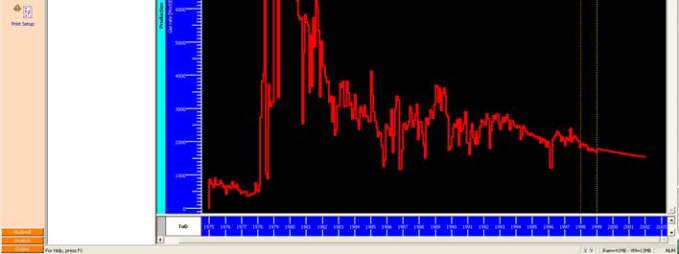
Click on OK to validate, and wait until both models have been extended to the profile end date.
The resulting gas field production will then be displayed in the Multiwell tab:
Fig. B05.3 • Generated field profile for gas production