Basic HTML Version


Ecrin v4.12 - Doc v4.12.02 - © KAPPA 1988-2009
Ecrin Guided Session #1
• Ecr
GS01 - 16/37
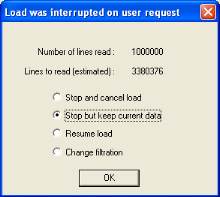
For the sake of illustrating the 'Dynamic Update' option in Diamant, we will
the
loading process, approximately half way before completion. This time, do not resume loading
after the interruption, but choose the
'Stop but keep current data'
option.
Fig. C01.20
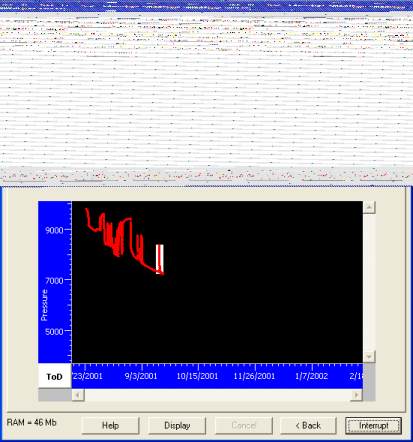
• Loading Pressure
From the data browser, select EcrGS01p and choose the 'View Plot' display mode: Pressure
data are shown as points by default as opposed to the rates that are shown as steps.
Click on the
icon and change the appearance of the pressure data to red points, click on
the button in the data set properties dialog, and change the screen appearance to
red
.
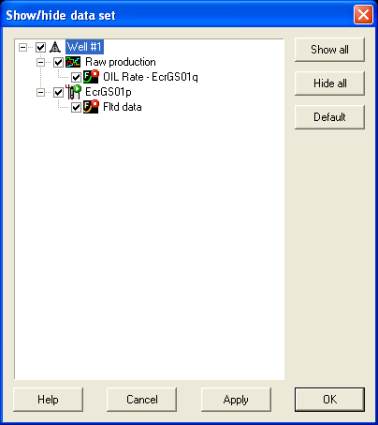
Select the 'Well #1' node and hit the
‘Show/hide data set’ icon
in the
toolbar.
This option allows you to select the
data set that you wish to display.
You can either enable ‘EcrGS01p’ or
press the ‘Show all’ button. Hit OK to
confirm your selection.
Fig. C01.21 Show/hide data set
The plot is updated and now includes both the oil rate and the (incomplete) pressure data set
as seen on Figure C01.22.