Basic HTML Version


Ecrin v4.12 - Doc v4.12.02 - © KAPPA 1988-2009
Saphir Guided Session #6
•
SapGS06 - 7/7
Fig. B01.10 • 2D Geometry plot
Click on the toolbar button
in the Geometry plot to display the pseudo 3D plot. The
shading is Sw and the vertical scale is the pressure.
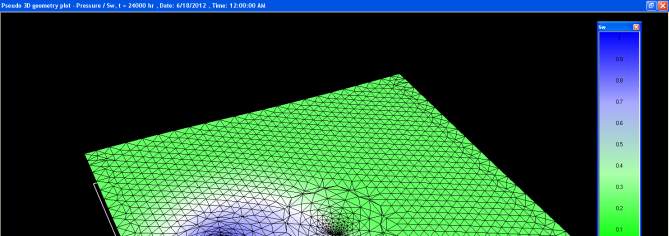
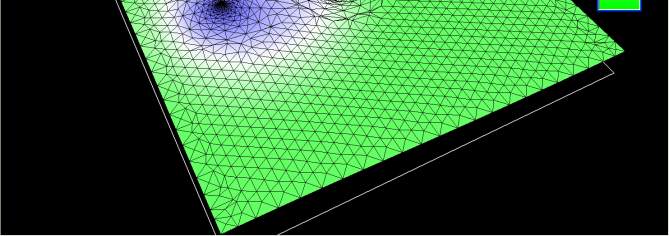
The 3D plot will look something like Figure B01.11 depending on the settings and the zoom
applied. The pseudo 3D plot exhibits the pressure variation as the vertical scale, showing
clearly the injection and the production well. The color coding is the evolution of Sw (in this
case after 1,000 days production). The plot indicates clearly that the injected water is pouring
into the producing well.
Fig B01.11 • Pseudo 3D Geometry plot