Basic HTML Version


Ecrin v4.12 - Doc v4.12.02 - © KAPPA 1988-2009
Saphir Guided Session #6
•
SapGS06 - 6/7
Fig. B01.8 • History plot
B01.5 • Simulation value fields
The geometry plot is automatically created.
Maximize the plot and click on the Settings icon to define the settings of the value fields to
be displayed. The field values 'Pressure', 'Sw' and 'So' have been generated and can be
selected using the droplist under 'Values’. Choose the field value Sw (water saturation).
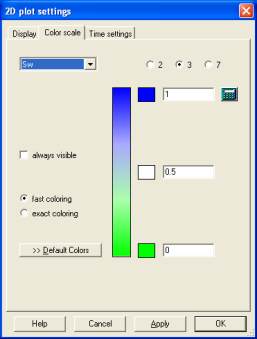
Click on the 'Color scale' tab and check that you have 3 colors as illustrated in Figure B01.9.
Check the 'always visible' checkbox which will display the scale of the color coding of
the current value field. Then click the
button to return to 0, and play back the fields using
the button .
Fig. B01.9 • 2D Plot Settings
Early in the playback it is clearly observed that water is breaking through, Figure B01.10.