Basic HTML Version


Ecrin v4.12 - Doc v4.12.02 - © KAPPA 1988-2009
Saphir Guided Session #4
•
SapGS04 - 5/11
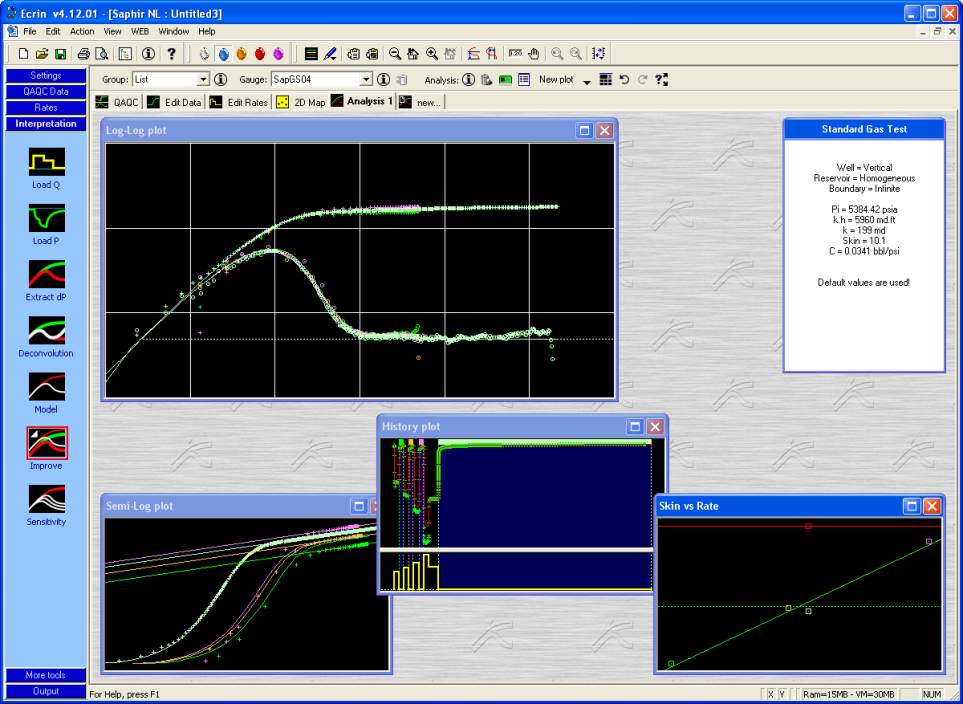
Fig. C01.2 • Saphir screen after generation of skin versus rate plot
The Skin versus Rate plot contains two straight lines, the red is the constant model skin and
the green is the regressed line through the skin values transported from the semilog lines.
The red point is associated with the model skin from buildup #4, the yellow point is the
semilog skin from the same buildup.
The reason they do not coincide is because the semilog lines were placed too early in order to
capture some information about the skin from the much shorter buildups of the isochronal
sequence (0.5 hours versus 20 hours final buildup time). This is a common problem and
highlights the fact that the isochronal sequence duration was too short.
Maximize the skin versus rate plot and click on to see the rate dependency result.
C01.2 • How to apply the rate dependency in the model
Click on the Model icon to access the Model dialog. Check the Rate dependent skin option, this
will add two parameters in the Model dialog. Click on the calculator button besides Skin0 and
choose the option From skin vs rate plot, do the same for dS/dQ. Now Generate the model, the
history match is not perfect so we will run the Improve option, but this time on the simulation
(history plot). Check only the values of C, Skin0, dS/dQ and Pi as shown in Figure C01.3, note
that the regression is run on simulation and that k is not included in the regression: