Basic HTML Version


Ecrin v4.12 - Doc v4.12.02 - © KAPPA 1988-2009
Saphir Guided Session #3
•
SapGS03 - 7/13
It is also possible to move from field to field in time by the use of the back
and forward
icons. Alternatively you can choose exactly which field you want to display in the Settings
dialog accessed from the
icon. In the same dialog you can define the items you want to
display on the Geometry plot, which type of field to display when other field types (other than
pressure) have been generated by the simulation. You are also able to modify the color scale.
Click on this icon and choose the tab
, choose 'View field at' 500 hours. Click on OK
to validate the changes.
Click on
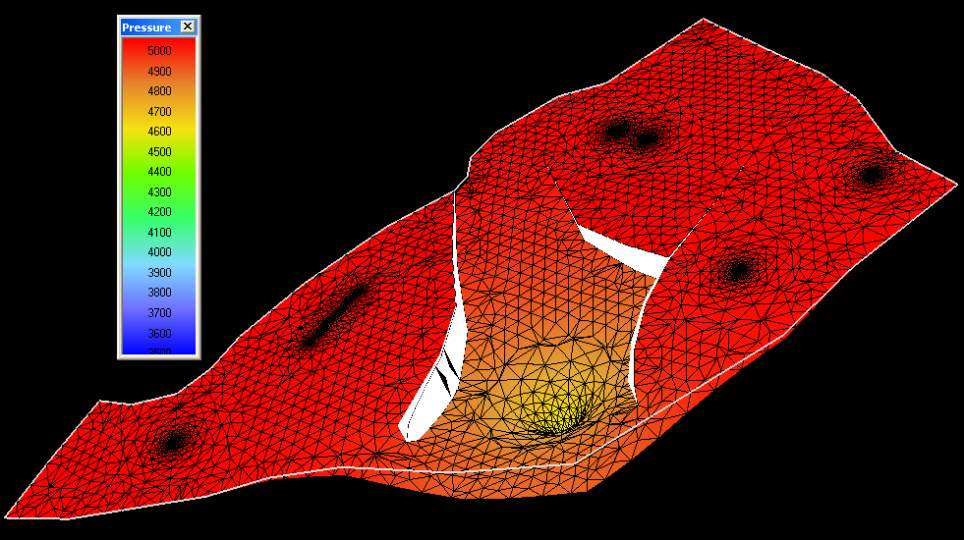
to display the 500 hours field in pseudo 3D view, you may have to use the zoom
options
in order to get a similar screen as the one shown in
Figure C01.4. To show the surface, select ‘show surface’ in the 3D Plot Settings dialog called
by . To display the color Scale, check the 'always visible' option of the Color Scale tab.
It is quite remarkable how this view confirms that mostly the channel is being drained after
500 hours production.
Fig. C01.4 • Pseudo 3D view