Basic HTML Version


Ecrin v4.
v4.12.02 -
2009
Saphir Guided Session #3
•
SapGS03 - 6/13
12 - Doc
© KAPPA 1988-
Fig. C01.2 • Loglog plot and pressure fields
Fig. C01.3 • Model match with analytical model
The generation of the analytical model will remove the 2D Geometry plot. Go back to the
Model dialog and regenerate the numerical model with the default parameters as before with
the option 'store pressure fields'.
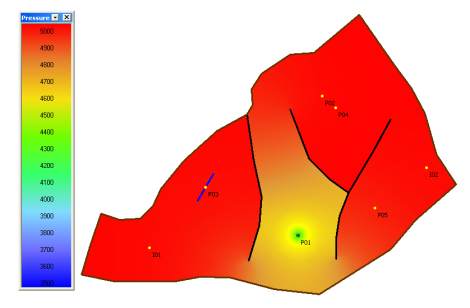
C01.2 • Geometry plot
As we chose to store the pressure fields during the generation of the numerical model we can
now study the evolution of the fields in greater detail.
Maximize the Geometry plot.
In the plot toolbar we have some 'tape record' type icons. These are used to browse from a
pressure field captured at a preset rate and time to another and can be used to play back the
whole sequence. Click on
to move to the first recorded field at production startup. Then
click on to play back all the stored fields.