Basic HTML Version


Ecrin v4.12 - Doc v4.12.02 - © KAPPA 1988-2009
Saphir Guided Session #3
•
SapGS03 - 3/13
The next step is to draw the contour of the field. Click on
and start by a first click
anywhere on the contour indicated by the bitmap, move the mouse to a next point on the
contour, click again.
Proceed around the contour by moving the mouse and clicking until the 'rubber band' of the
overlaid trace is complete. Double click to finish. Any time a mistake is made you can go back
by using the ‘Esc.’ key. A double click on the contour will bring up the contour dialog where
you can reset the contour to a circle or rectangle and check the size of the current contour
area. The trajectory can be loaded from an outside file or modified manually. Segments of the
contour can be set to constant pressure or sealing.
There is a scale indicator on the map and we need to set the scale. Click on
and use the
mouse to draw a line from 0 to 1000 m on the scale indicator. To be more accurate it is a good
idea to zoom on the scale indicator before this operation. Set
1000 m
in the Length box of the
dialog. Click OK and you will be prompted to 'Update well coordinates using new scale', press
OK to confirm.
Finally we will draw the sealing faults indicated on the bitmap. Click on and use exactly the
same technique used to draw the contour. When a node on the contour or on an existing fault
turns green it means that the fault you are in the process of drawing will snap to this point.
Double clicking on a fault will bring up the fault dialog where the fault hydraulic properties can
be edited (leakage factor, hydraulic conductivity for conductive faults, etc...). The trajectory
can also be edited and modified.
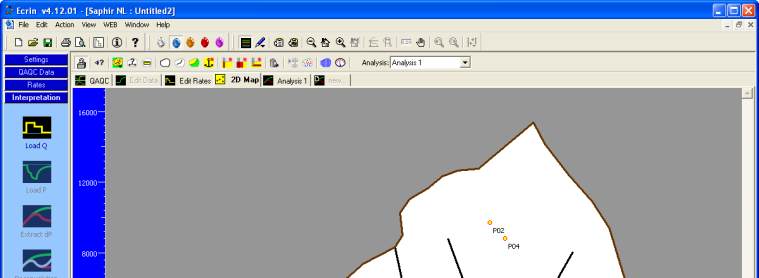
The bitmap is only a visualization of the field and has helped you to set up the model, it is
no longer needed and it can be hidden. Click on
to hide it by selecting ‘show nothing’ in
the Display settings dialog. Your 2D Map should then look like Figure B01.3.
Fig. B01.3 • Finalized model