Basic HTML Version


Ecrin v4.12 - Doc v4.12.02 - © KAPPA 1988-2009
Saphir Guided Session #2
• Sa
pGS02 - 2/8
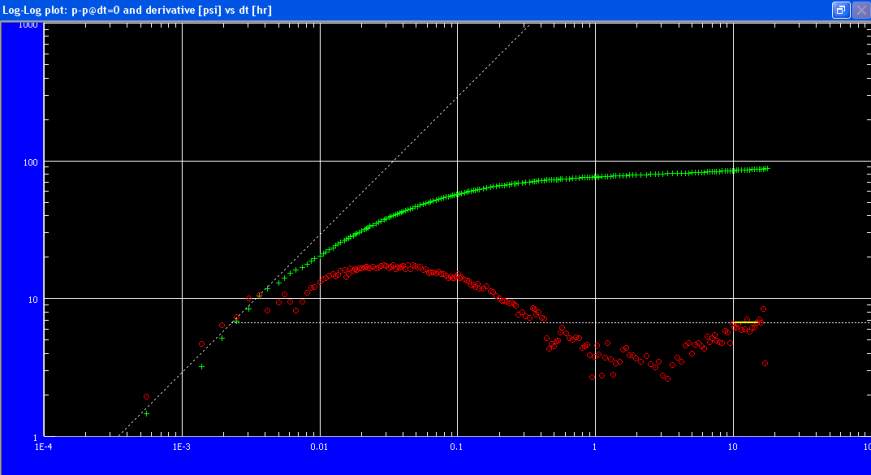
The pressure derivative shows the typical trends of a reservoir with pseudo steady state
double-porosity. However, none of the theoretical stabilization levels is apparent in the data.
In a double-porosity (or 2 layer) model, IARF (Infinite Acting Radial Flow) must correspond to
radial flow in the total system. The final diagnostic (the decision as to which interpretation
model may be the most appropriate) can only be made after the interpreter has fixed the level
of the IARF flow line (the white dotted horizontal line).
In this case as the shape of the derivative curve indicated the response from a double porosity
reservoir it is obvious that the white dotted line has to be moved above the lower valley in the
derivative. This can be achieved by simply click and drag in the loglog plot moving the white
dotted line to correspond to the very end of the derivative curve. You can also use the semilog
straight-line option and regress a line in the loglog plot through the end of the derivative data.
Maximize the loglog plot using a double click in the plot header. Define a semilog line at the
end of the derivative; right click in the loglog plot to access the popup menu, 'Line -
Regression'. Click from your chosen start of the semilog straight-line and click again at the
end.
The maximized loglog plot reverts to the semilog plot automatically. The corresponding results
are also automatically displayed. Close the Results dialog.
De-maximize the semilog plot and return to the maximized loglog plot. Now you can reset the
match by using the Reset match icon
, the pressure match snaps to the IARF straight line
making the semilog slope and the pressure match consistent. Figure B01.2.
Fig. B01.2 • Loglog plot
The semilog straight line is shown in the loglog plot as a yellow line, and this line is also shown
in the semilog plot as illustrated in Figure B01.3.