
Dynamic Data Analysis – v5.12.01 - © KAPPA 1988-2017
Chapter
1 – I ntroduction- p7/743
Though one would wish to have a perfect understanding of the underlying physical behaviors
and use the different methodologies and modeling capabilities available for the analysis of
dynamic data, lack of time, and sometimes lack of data, make the process nearly impossible to
apply when an engineer has to handle hundreds of wells on a daily basis.
This is particularly the case for unconventional resources (see chapter 10), where thousands of
wells are drilled and fraced without virtually any metrology. In these cases pragmatism
dictates the use of empirical decline curves, to which physical models may be substituted when
a few wells have been properly monitored, interpreted and modeled. This area is called
Field
Performance Analysis
. For KAPPA this is the scope of
Citrine
, developed in cooperation with
DeGolyer and MacNaughton, and initially released in 2014.
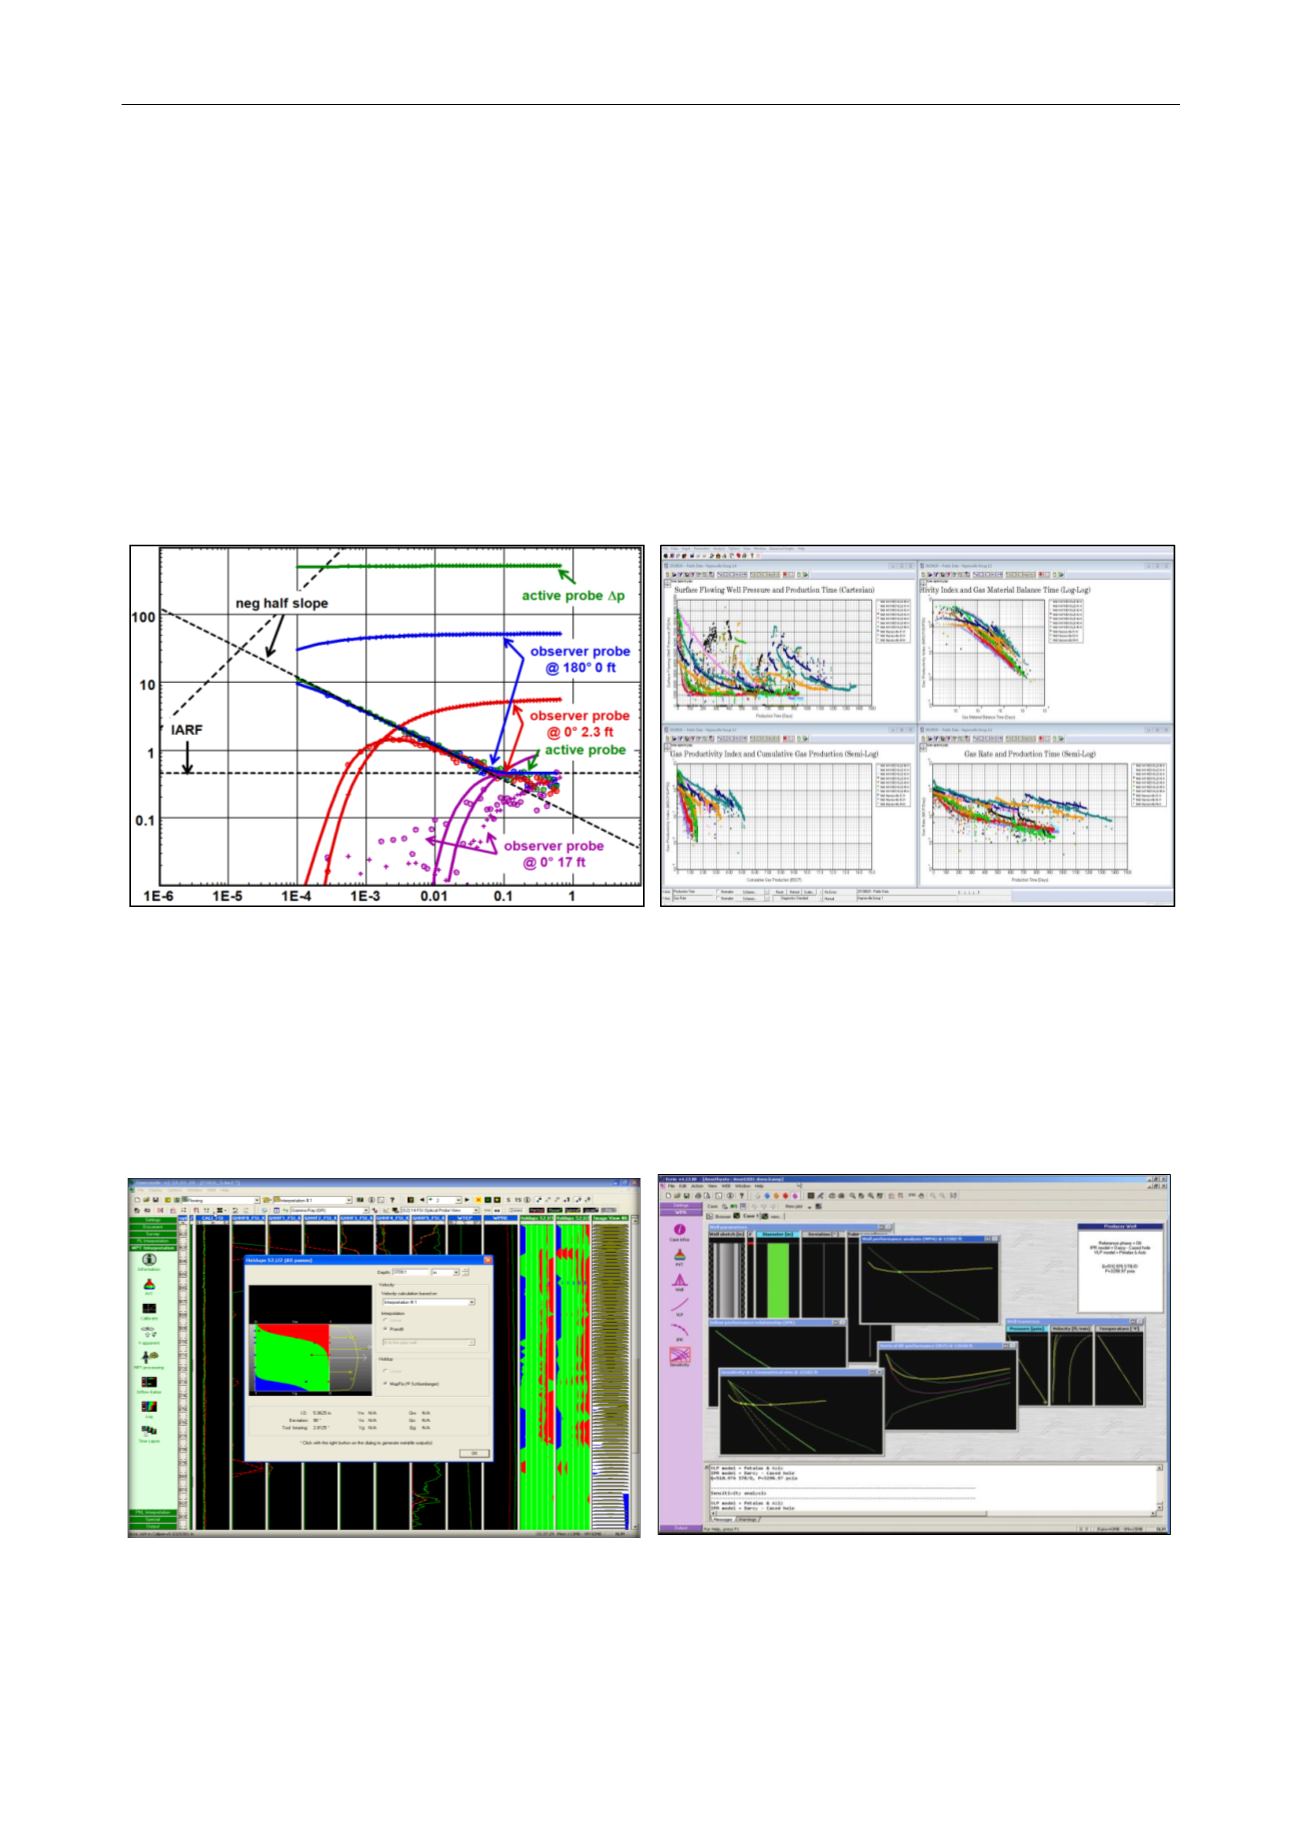
Fig. 1.B.3 – Formation Testing (Azurite) and Field Performance Analysis (Citrine)
Production Logging
, or PL tools used to be run when something was wrong with the well
production. In the past twenty years this perception has evolved. PL is now a full scale
reservoir tool, especially in multilayered formations and for complex well geometries (see
chapter 17). In KAPPA this is the scope of
Emeraude
, initially released in 1996.
Fig. 1.B.4 – Production Logging (Emeraude) and Nodal Analysis (Amethyste)


