Basic HTML Version


VA – GP - OA: Numerical Multiphase PTA
p 17/29
On Figure 21, however, a significant part of the mobility decrease is also linked to the increase
of the oil viscosity when pressure drops below Pb. In particular, the (non-linear) viscosity
increase is mainly responsible for the bending trend of the k=50 mD derivative.
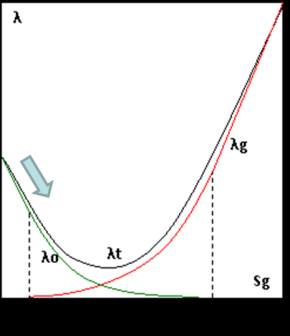
Figure
22: Effect of gas apparition on the total mobility, for constant µ
Let us now consider a larger depletion, with R=5,000 ft and k=500 mD (Figure 23). The loglog
plot derivative can be easily interpreted. The pseudo permanent behavior is reached quickly,
around t=50 h, and displays a unit slope until the bubble point is reached, at the well first (at
approximately t=1200 hr) but soon everywhere (boundaries reached around t=2,500 hr). This
gas apparition is followed by a numerical oscillation. Once gas is present everywhere, the
depletion model at constant compressibility (slope 1) hence becomes a model with increasing
compressibility. If we assume that the compressibility is proportional to the gas saturation,
which is almost proportional to ∆P, the derivative should continue to increase with a slope ½,
as confirmed by the simulation result.
Figure
23: Production phase for R=5,000 ft, k=500 mD
If the permeability is decreased to k=100 mD (large depletion) a new regime becomes
apparent, with a decrease of the derivative level (right of Figure 24). This corresponds to the
presence of mobile gas everywhere, with higher saturations compared to the k=500 mD case.
As a consequence, the total mobility increases in the medium, as could be predicted from the
right side of Figure 22.
0.01
0.1
1
10
100
1000
10000
Time [hr]
10
100
1000