Basic HTML Version


Ecrin v4.12 - Doc v4.12.02 - © KAPPA 1988-2009
Rubis Guided Session #3
• Rub
GS03 - 15/22
In the same plot maximize the “Influx” view to visualize the water influx coming from the
aquifer into the reservoir – a total of approximately 0.3 MMSTB of water has invaded the
reservoir after 11 years of production:
Fig. B02.4 • Global results, water influx vs. time
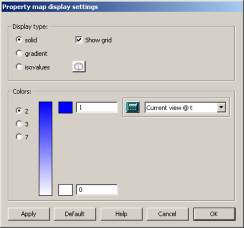
Maximize the 2D Geometry plot, choose “Sw” as the property to be displayed and click on
in the plot toolbar to change the current display settings:
Fig. B02.5 • Property map display settings
In the above, set the display type to “gradient” and uncheck the “Show grid” box. Click on OK
to validate the changes.